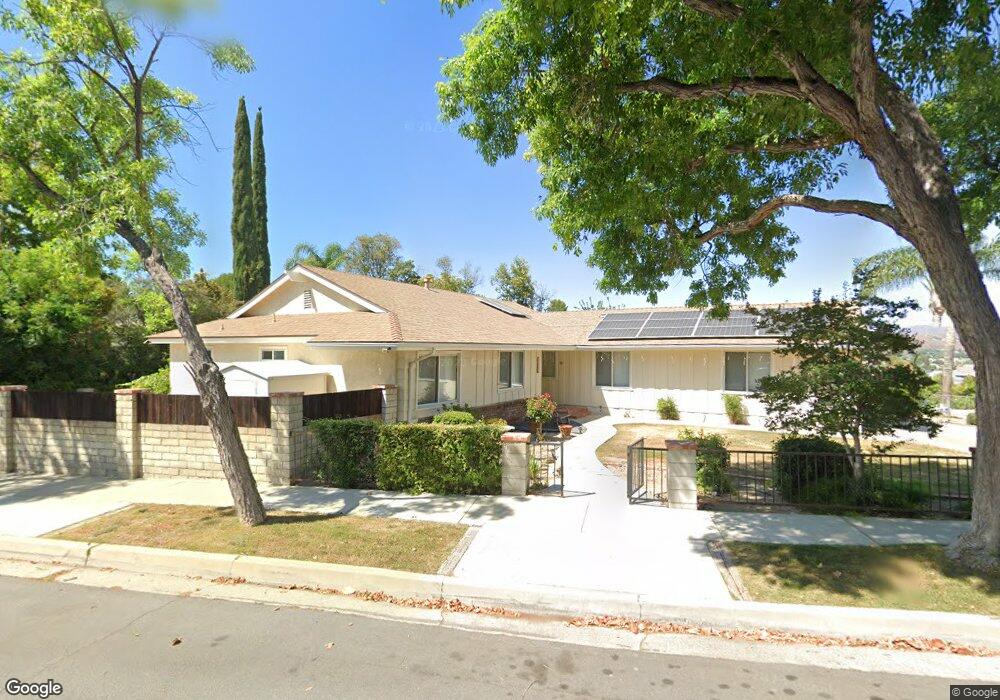
22300 Canones Cir Santa Clarita, CA 91350
Saugus NeighborhoodEstimated Value: $823,055 - $881,000
4
Beds
3
Baths
2,006
Sq Ft
$426/Sq Ft
Est. Value
About This Home
This home is located at 22300 Canones Cir, Santa Clarita, CA 91350 and is currently estimated at $855,514, approximately $426 per square foot. 22300 Canones Cir is a home located in Los Angeles County with nearby schools including Highlands Elementary School, Arroyo Seco Junior High School, and Saugus High School.
Ownership History
Date
Name
Owned For
Owner Type
Purchase Details
Closed on
Jul 27, 2018
Sold by
Sugasawara Dennis
Bought by
Sugasawara Melinda M
Current Estimated Value
Purchase Details
Closed on
Jul 15, 2015
Sold by
Sugasawara Chizu
Bought by
Sugasawara Dennis
Purchase Details
Closed on
Jun 9, 2005
Sold by
Sugasawara Dennis and Sugasawara Melinda M
Bought by
Sugasawara Dennis and Sugasawara Melinda
Purchase Details
Closed on
Aug 2, 2000
Sold by
Bruce Willard C
Bought by
Bruce Caroline M
Home Financials for this Owner
Home Financials are based on the most recent Mortgage that was taken out on this home.
Original Mortgage
$164,000
Interest Rate
8.12%
Purchase Details
Closed on
Jun 30, 2000
Sold by
Bruce Caroline M
Bought by
Sugasawara Dennis and Sugasawara Melinda M
Home Financials for this Owner
Home Financials are based on the most recent Mortgage that was taken out on this home.
Original Mortgage
$164,000
Interest Rate
8.12%
Create a Home Valuation Report for This Property
The Home Valuation Report is an in-depth analysis detailing your home's value as well as a comparison with similar homes in the area
Home Values in the Area
Average Home Value in this Area
Purchase History
| Date | Buyer | Sale Price | Title Company |
|---|---|---|---|
| Sugasawara Melinda M | -- | None Available | |
| Sugasawara Melinda M | -- | None Available | |
| Sugasawara Dennis | -- | None Available | |
| Sugasawara Dennis | -- | None Available | |
| Sugasawara Dennis | -- | -- | |
| Bruce Caroline M | -- | Chicago Title Co | |
| Sugasawara Dennis | $244,000 | Chicago Title Co |
Source: Public Records
Mortgage History
| Date | Status | Borrower | Loan Amount |
|---|---|---|---|
| Previous Owner | Sugasawara Dennis | $164,000 |
Source: Public Records
Tax History Compared to Growth
Tax History
| Year | Tax Paid | Tax Assessment Tax Assessment Total Assessment is a certain percentage of the fair market value that is determined by local assessors to be the total taxable value of land and additions on the property. | Land | Improvement |
|---|---|---|---|---|
| 2025 | $5,236 | $367,646 | $189,248 | $178,398 |
| 2024 | $5,236 | $360,438 | $185,538 | $174,900 |
| 2023 | $5,082 | $353,371 | $181,900 | $171,471 |
| 2022 | $5,184 | $346,443 | $178,334 | $168,109 |
| 2021 | $5,093 | $339,651 | $174,838 | $164,813 |
| 2019 | $4,915 | $329,579 | $169,653 | $159,926 |
| 2018 | $4,653 | $323,118 | $166,327 | $156,791 |
| 2016 | $4,380 | $310,572 | $159,869 | $150,703 |
| 2015 | $4,216 | $305,908 | $157,468 | $148,440 |
| 2014 | $4,150 | $299,917 | $154,384 | $145,533 |
Source: Public Records
Map
Nearby Homes
- 27231 Cabrera Ave
- 22123 Alamogordo Rd
- 27215 Elias Ave
- 22346 Cheraw Dr
- 22003 Caceras St
- 26724 Diaz Dr
- 26953 Cuatro Milpas St
- 26721 Diaz Dr
- 27021 Rio Bosque Dr
- 26927 Cuatro Milpas St
- 22725 Garzota Dr
- 22500 Festividad Dr
- 22810 Rio Chico Dr
- 26861 Cuatro Milpas St
- 27127 Rio Bosque Dr
- 21983 Centurion Way
- 22903 Vista Delgado Dr
- 21827 Centurion Way
- 27547 Saffron Ln
- 27619 Ron Ridge Dr
- 22314 Canones Cir
- 22345 Barbacoa Dr
- 22351 Barbacoa Dr
- 22296 Canones Cir
- 22320 Canones Cir
- 22355 Barbacoa Dr
- 22337 Barbacoa Dr
- 22315 Canones Cir
- 22301 Canones Cir
- 22288 Canones Cir
- 22328 Canones Cir
- 22323 Canones Cir
- 22361 Barbacoa Dr
- 22333 Barbacoa Dr
- 22287 Canones Cir
- 22329 Canones Cir
- 22336 Canones Cir
- 22367 Barbacoa Dr
- 22329 Barbacoa Dr
- 22348 Barbacoa Dr