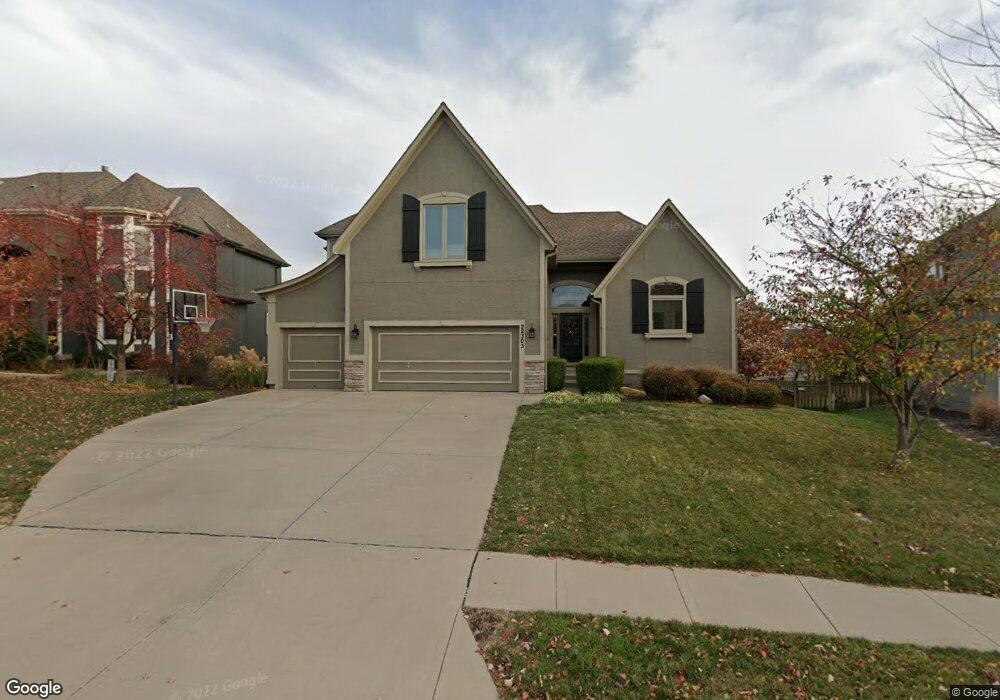
22303 W 56th St Shawnee, KS 66226
Estimated Value: $603,906 - $639,000
5
Beds
5
Baths
2,817
Sq Ft
$222/Sq Ft
Est. Value
About This Home
This home is located at 22303 W 56th St, Shawnee, KS 66226 and is currently estimated at $624,227, approximately $221 per square foot. 22303 W 56th St is a home located in Johnson County with nearby schools including Prairie Ridge Elementary School, Monticello Trails Middle School, and Mill Valley High School.
Ownership History
Date
Name
Owned For
Owner Type
Purchase Details
Closed on
Aug 13, 2012
Sold by
Wood Matthew G and Riddle Wood Catherine E K
Bought by
Wood Matthew G and Wood Catherine E
Current Estimated Value
Home Financials for this Owner
Home Financials are based on the most recent Mortgage that was taken out on this home.
Original Mortgage
$40,000
Outstanding Balance
$23,387
Interest Rate
3.57%
Mortgage Type
Credit Line Revolving
Estimated Equity
$600,840
Purchase Details
Closed on
Sep 27, 2005
Sold by
James Iii Homes Inc
Bought by
Wood Matthew G and Riddle Wood Cahterine E K
Home Financials for this Owner
Home Financials are based on the most recent Mortgage that was taken out on this home.
Original Mortgage
$269,512
Interest Rate
5.9%
Mortgage Type
New Conventional
Purchase Details
Closed on
May 17, 2005
Sold by
Crey Oaks L L C
Bought by
James Iii Homes Inc
Create a Home Valuation Report for This Property
The Home Valuation Report is an in-depth analysis detailing your home's value as well as a comparison with similar homes in the area
Home Values in the Area
Average Home Value in this Area
Purchase History
| Date | Buyer | Sale Price | Title Company |
|---|---|---|---|
| Wood Matthew G | -- | Continental Title | |
| Wood Matthew G | -- | First American Title Ins Co | |
| James Iii Homes Inc | -- | First American Title |
Source: Public Records
Mortgage History
| Date | Status | Borrower | Loan Amount |
|---|---|---|---|
| Open | Wood Matthew G | $40,000 | |
| Open | Wood Matthew G | $233,938 | |
| Closed | Wood Matthew G | $269,512 |
Source: Public Records
Tax History Compared to Growth
Tax History
| Year | Tax Paid | Tax Assessment Tax Assessment Total Assessment is a certain percentage of the fair market value that is determined by local assessors to be the total taxable value of land and additions on the property. | Land | Improvement |
|---|---|---|---|---|
| 2024 | $7,542 | $64,573 | $12,303 | $52,270 |
| 2023 | $7,131 | $60,582 | $11,714 | $48,868 |
| 2022 | $6,845 | $56,983 | $11,153 | $45,830 |
| 2021 | $6,419 | $51,485 | $10,138 | $41,347 |
| 2020 | $6,127 | $48,691 | $10,138 | $38,553 |
| 2019 | $6,110 | $47,852 | $9,221 | $38,631 |
| 2018 | $5,975 | $46,380 | $8,385 | $37,995 |
| 2017 | $6,091 | $46,127 | $7,289 | $38,838 |
| 2016 | $6,081 | $45,494 | $7,289 | $38,205 |
| 2015 | $5,964 | $43,735 | $7,289 | $36,446 |
| 2013 | -- | $40,308 | $7,289 | $33,019 |
Source: Public Records
Map
Nearby Homes
- 5531 Hilltop Dr
- 22209 W 57th St
- 22605 W 56th St
- 5402 Roundtree St
- 5206 Round Prairie St
- 24621 W 60th St
- 21804 W 52nd Terrace
- 22115 W 51st Terrace
- 21315 W 56th St
- 21403 W 54th Terrace
- 21309 W 56th St
- 21217 W 55th Terrace
- 5405 Lakecrest Dr
- 5311 Brownridge Dr
- 5725 Marion St
- 5221 Meadow View Dr
- 6031 Lakecrest Dr
- 5002 Woodsonia Dr
- 22910 W 51st St
- 22625 W 49th St
- 22213 W 56th St
- 22307 W 56th St
- 5608 Roundtree St
- 22236 W 57th St
- 22207 W 56th St
- 22311 W 56th St
- 5605 Roundtree St
- 5531 Chouteau St
- 5534 Chouteau St
- 22203 W 56th St
- 22240 W 57th St
- 22232 W 57th St
- 22315 W 56th St
- 5614 Roundtree St
- 22302 W 57th St
- 5530 Chouteau St
- 22113 W 56th St
- 5520 Roundtree St
- 22319 W 56th St
- 5525 Chouteau St