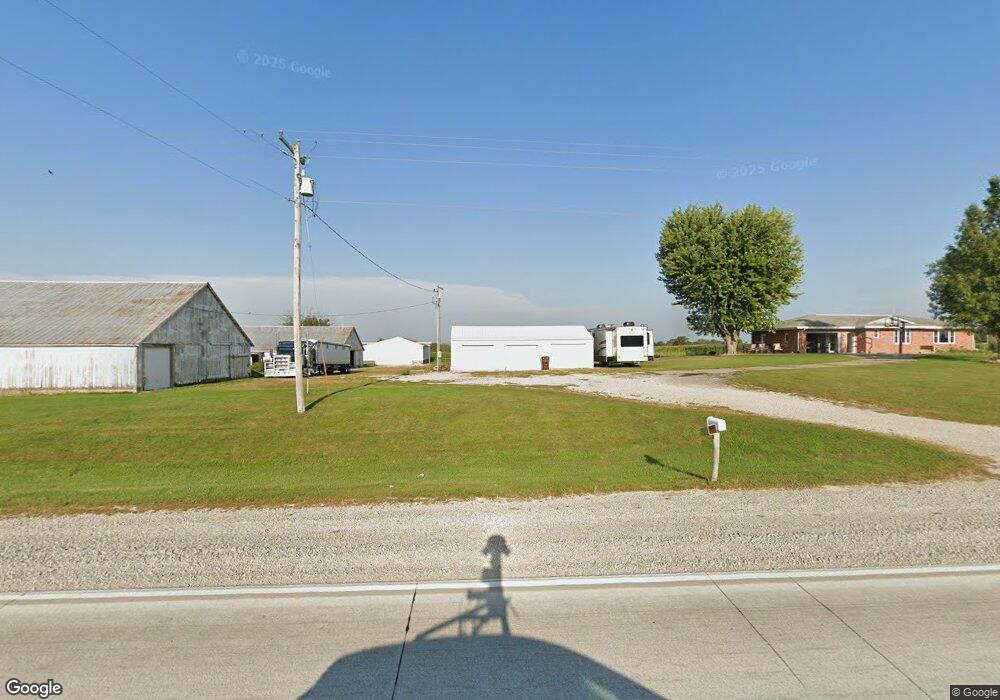
2231 180th Ave Donnellson, IA 52625
Estimated Value: $185,000 - $312,312
3
Beds
2
Baths
1,296
Sq Ft
$173/Sq Ft
Est. Value
About This Home
This home is located at 2231 180th Ave, Donnellson, IA 52625 and is currently estimated at $224,828, approximately $173 per square foot. 2231 180th Ave is a home with nearby schools including Central Lee Elementary School, Central Lee Middle School, and Central Lee High School.
Ownership History
Date
Name
Owned For
Owner Type
Purchase Details
Closed on
Oct 12, 2016
Sold by
Abolt Tori Lynn
Bought by
Abolt Martin John
Current Estimated Value
Purchase Details
Closed on
Jul 14, 2005
Sold by
Hoyer Fred R and Hoyer Norma J
Bought by
Graber Jeffrey L and Graber Gayle A
Home Financials for this Owner
Home Financials are based on the most recent Mortgage that was taken out on this home.
Original Mortgage
$175,000
Outstanding Balance
$90,890
Interest Rate
5.68%
Mortgage Type
Future Advance Clause Open End Mortgage
Estimated Equity
$133,938
Create a Home Valuation Report for This Property
The Home Valuation Report is an in-depth analysis detailing your home's value as well as a comparison with similar homes in the area
Home Values in the Area
Average Home Value in this Area
Purchase History
| Date | Buyer | Sale Price | Title Company |
|---|---|---|---|
| Abolt Martin John | -- | None Available | |
| Graber Jeffrey L | $115,000 | None Available |
Source: Public Records
Mortgage History
| Date | Status | Borrower | Loan Amount |
|---|---|---|---|
| Open | Graber Jeffrey L | $175,000 |
Source: Public Records
Tax History Compared to Growth
Tax History
| Year | Tax Paid | Tax Assessment Tax Assessment Total Assessment is a certain percentage of the fair market value that is determined by local assessors to be the total taxable value of land and additions on the property. | Land | Improvement |
|---|---|---|---|---|
| 2025 | $2,548 | $260,270 | $39,120 | $221,150 |
| 2024 | $2,548 | $228,330 | $39,120 | $189,210 |
| 2023 | $2,618 | $228,330 | $39,120 | $189,210 |
| 2022 | $2,040 | $168,890 | $31,080 | $137,810 |
| 2021 | $2,040 | $168,890 | $31,080 | $137,810 |
| 2020 | $2,068 | $162,830 | $32,950 | $129,880 |
| 2019 | $2,038 | $162,830 | $32,950 | $129,880 |
| 2018 | $2,012 | $153,610 | $0 | $0 |
| 2017 | $2,042 | $145,040 | $0 | $0 |
| 2016 | $1,968 | $145,040 | $0 | $0 |
| 2015 | $1,968 | $139,210 | $0 | $0 |
| 2014 | $1,940 | $139,210 | $0 | $0 |
Source: Public Records
Map
Nearby Homes