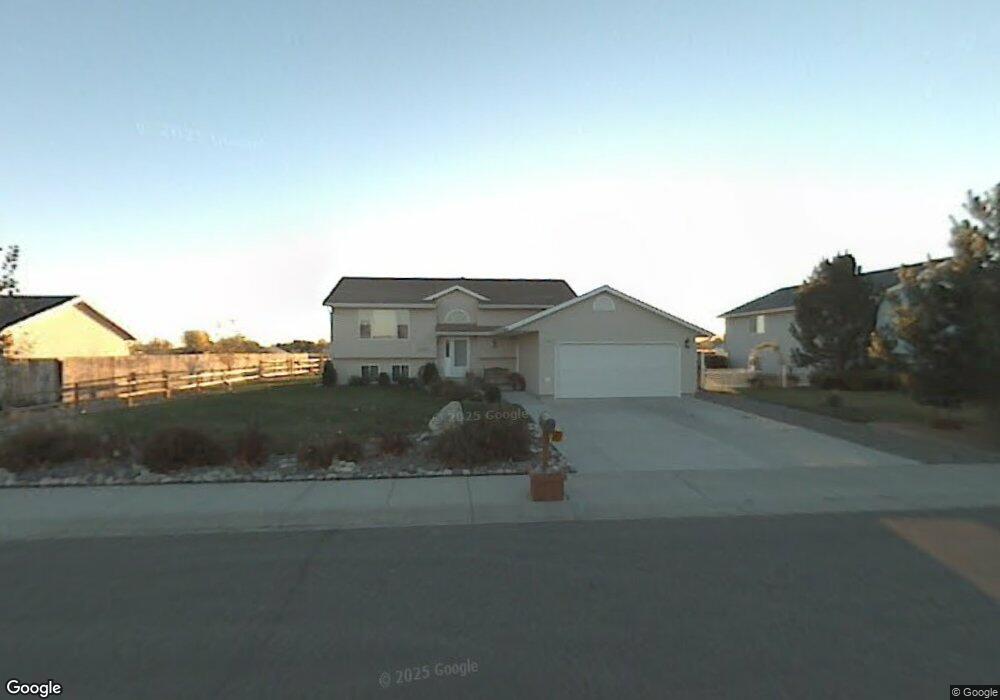
2231 Hyacinth Dr Billings, MT 59105
Billings Heights NeighborhoodEstimated Value: $359,556 - $389,000
4
Beds
2
Baths
2,040
Sq Ft
$182/Sq Ft
Est. Value
About This Home
This home is located at 2231 Hyacinth Dr, Billings, MT 59105 and is currently estimated at $371,889, approximately $182 per square foot. 2231 Hyacinth Dr is a home located in Yellowstone County with nearby schools including Beartooth School, Medicine Crow Middle School, and Skyview High School.
Ownership History
Date
Name
Owned For
Owner Type
Purchase Details
Closed on
Jul 2, 2011
Sold by
Kelley Michael J and Kelley Allyson S
Bought by
Harper Steven G
Current Estimated Value
Home Financials for this Owner
Home Financials are based on the most recent Mortgage that was taken out on this home.
Original Mortgage
$193,950
Outstanding Balance
$133,116
Interest Rate
4.46%
Mortgage Type
VA
Estimated Equity
$238,773
Purchase Details
Closed on
Mar 6, 2009
Sold by
Jones Jerry W and Jones Rena W
Bought by
Kelley Michael J and Kelley Allyson S
Home Financials for this Owner
Home Financials are based on the most recent Mortgage that was taken out on this home.
Original Mortgage
$190,000
Interest Rate
5.08%
Mortgage Type
Purchase Money Mortgage
Purchase Details
Closed on
Oct 28, 2005
Sold by
Stene Oscar B and Stene Darlene S
Bought by
Jones Jerry W and Jones Rena W
Home Financials for this Owner
Home Financials are based on the most recent Mortgage that was taken out on this home.
Original Mortgage
$166,155
Interest Rate
5.68%
Mortgage Type
New Conventional
Create a Home Valuation Report for This Property
The Home Valuation Report is an in-depth analysis detailing your home's value as well as a comparison with similar homes in the area
Home Values in the Area
Average Home Value in this Area
Purchase History
| Date | Buyer | Sale Price | Title Company |
|---|---|---|---|
| Harper Steven G | -- | Chicago Title | |
| Kelley Michael J | -- | None Available | |
| Jones Jerry W | -- | None Available |
Source: Public Records
Mortgage History
| Date | Status | Borrower | Loan Amount |
|---|---|---|---|
| Open | Harper Steven G | $193,950 | |
| Previous Owner | Kelley Michael J | $190,000 | |
| Previous Owner | Jones Jerry W | $166,155 |
Source: Public Records
Tax History Compared to Growth
Tax History
| Year | Tax Paid | Tax Assessment Tax Assessment Total Assessment is a certain percentage of the fair market value that is determined by local assessors to be the total taxable value of land and additions on the property. | Land | Improvement |
|---|---|---|---|---|
| 2025 | $2,207 | $371,100 | $62,473 | $308,627 |
| 2024 | $2,207 | $311,300 | $58,922 | $252,378 |
| 2023 | $3,048 | $311,300 | $58,922 | $252,378 |
| 2022 | $2,333 | $247,100 | $0 | $0 |
| 2021 | $2,628 | $247,100 | $0 | $0 |
| 2020 | $2,595 | $232,400 | $0 | $0 |
| 2019 | $2,476 | $232,400 | $0 | $0 |
| 2018 | $2,266 | $207,400 | $0 | $0 |
| 2017 | $2,201 | $207,400 | $0 | $0 |
| 2016 | $2,027 | $192,700 | $0 | $0 |
| 2015 | $1,984 | $192,700 | $0 | $0 |
| 2014 | $1,954 | $101,230 | $0 | $0 |
Source: Public Records
Map
Nearby Homes
- 1203 Peony Dr
- 1320 Mading Dr
- 1512 Mary St
- 1403 Eugene Ave
- 1374 Kelsey Ln
- 2542 Kaley Ln
- TBD Barrett Rd
- 1512 Mustang Valley Dr
- 2530 Kaley Ln
- 1007 Crist Dr
- 1961 Bitterroot Dr
- 1526 Spring Gulch Way
- na Hawthorne Ln
- 1402 Eugene Way
- 1376 W Eugene Ave
- 1358 W Eugene Ave
- 1377 W Eugene Ave
- 1359 W Eugene Ave
- 901 Kale Dr
- 2695 Strapper Ln
- 2225 Hyacinth Dr
- 2237 Hyacinth Dr
- 2219 Hyacinth Dr
- 2241 Hyacinth Dr
- 2224 Hyacinth Dr
- 1257 Gardenia Dr
- 2213 Hyacinth Dr
- 1257 Nasturtium Dr
- 2245 Hyacinth Dr
- 1252 Gardenia Dr
- 1258 Caroline St
- 1251 Gardenia Dr
- 2209 Hyacinth Dr
- 1252 Caroline St
- 2307 Hyacinth Dr
- 1246 Gardenia Dr
- 1245 Gardenia Dr
- 1245 Nasturtium Dr
- 1258 Nasturtium Dr
- 1246 Caroline St