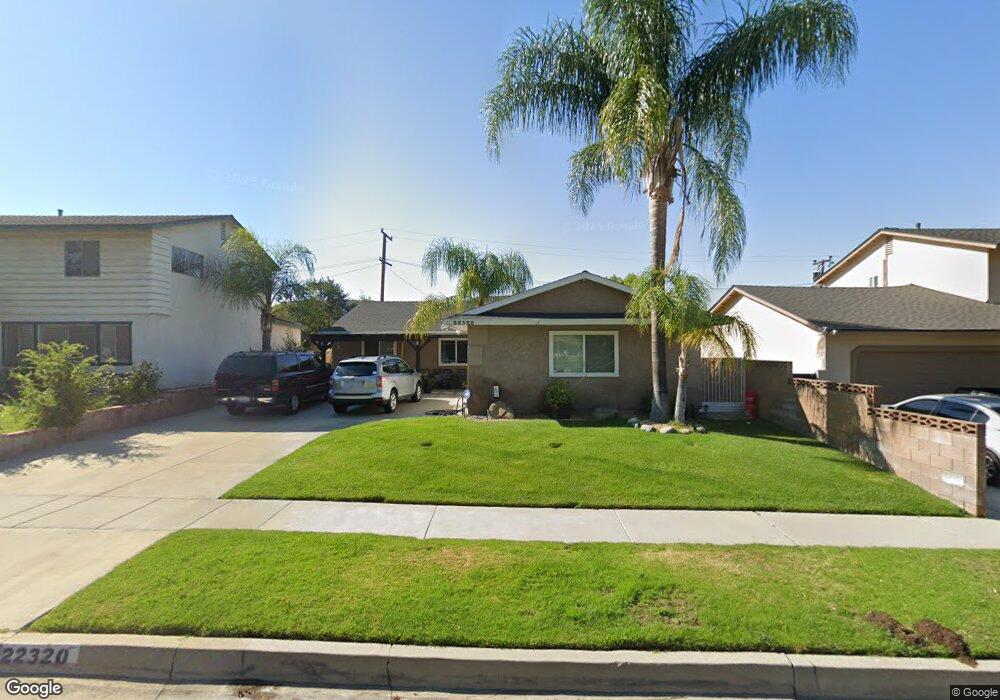
22320 Festividad Dr Santa Clarita, CA 91350
Saugus NeighborhoodEstimated Value: $719,103 - $757,000
4
Beds
2
Baths
1,376
Sq Ft
$543/Sq Ft
Est. Value
About This Home
This home is located at 22320 Festividad Dr, Santa Clarita, CA 91350 and is currently estimated at $746,776, approximately $542 per square foot. 22320 Festividad Dr is a home located in Los Angeles County with nearby schools including Emblem Academy, Arroyo Seco Junior High School, and Saugus High School.
Ownership History
Date
Name
Owned For
Owner Type
Purchase Details
Closed on
May 24, 2005
Sold by
Farrell Darren R
Bought by
Farrell Darren R and Farrell Tiffany A
Current Estimated Value
Home Financials for this Owner
Home Financials are based on the most recent Mortgage that was taken out on this home.
Original Mortgage
$200,000
Outstanding Balance
$103,476
Interest Rate
5.72%
Mortgage Type
New Conventional
Estimated Equity
$643,300
Purchase Details
Closed on
Jan 29, 1998
Sold by
Farrell Ronald R
Bought by
Farrell Darren R
Home Financials for this Owner
Home Financials are based on the most recent Mortgage that was taken out on this home.
Original Mortgage
$130,800
Interest Rate
7%
Purchase Details
Closed on
Jan 2, 1996
Sold by
Farrell Ronald Robert
Bought by
Farrell Ronald Robert and Farrell Diane Kay
Home Financials for this Owner
Home Financials are based on the most recent Mortgage that was taken out on this home.
Original Mortgage
$112,000
Interest Rate
7.18%
Create a Home Valuation Report for This Property
The Home Valuation Report is an in-depth analysis detailing your home's value as well as a comparison with similar homes in the area
Home Values in the Area
Average Home Value in this Area
Purchase History
| Date | Buyer | Sale Price | Title Company |
|---|---|---|---|
| Farrell Darren R | -- | Fidelity National Title Co | |
| Farrell Darren R | -- | Old Republic Title | |
| Farrell Ronald Robert | -- | Fidelity National Title Ins |
Source: Public Records
Mortgage History
| Date | Status | Borrower | Loan Amount |
|---|---|---|---|
| Open | Farrell Darren R | $200,000 | |
| Previous Owner | Farrell Darren R | $130,800 | |
| Previous Owner | Farrell Ronald Robert | $112,000 |
Source: Public Records
Tax History Compared to Growth
Tax History
| Year | Tax Paid | Tax Assessment Tax Assessment Total Assessment is a certain percentage of the fair market value that is determined by local assessors to be the total taxable value of land and additions on the property. | Land | Improvement |
|---|---|---|---|---|
| 2025 | $4,028 | $263,349 | $125,404 | $137,945 |
| 2024 | $4,028 | $258,187 | $122,946 | $135,241 |
| 2023 | $3,897 | $253,126 | $120,536 | $132,590 |
| 2022 | $3,908 | $248,164 | $118,173 | $129,991 |
| 2021 | $3,841 | $243,299 | $115,856 | $127,443 |
| 2019 | $3,712 | $236,085 | $112,421 | $123,664 |
| 2018 | $3,566 | $231,457 | $110,217 | $121,240 |
| 2016 | $3,354 | $222,471 | $105,938 | $116,533 |
| 2015 | $3,229 | $219,130 | $104,347 | $114,783 |
| 2014 | $3,178 | $214,838 | $102,303 | $112,535 |
Source: Public Records
Map
Nearby Homes
- 22500 Festividad Dr
- 26724 Diaz Dr
- 26721 Diaz Dr
- 22123 Alamogordo Rd
- 26861 Cuatro Milpas St
- 26927 Cuatro Milpas St
- 27231 Cabrera Ave
- 26953 Cuatro Milpas St
- 27215 Elias Ave
- 22725 Garzota Dr
- 22810 Rio Chico Dr
- 27021 Rio Bosque Dr
- 26425 Choral Ln
- 22003 Caceras St
- 22620 Dragonfly Ct
- 22346 Cheraw Dr
- 27127 Rio Bosque Dr
- 26607 Millhouse Dr
- 23054 La Granja Dr
- 22903 Vista Delgado Dr
- 22326 Festividad Dr
- 22314 Festividad Dr
- 22332 Festividad Dr
- 22308 Festividad Dr
- 26800 Espuma Dr
- 22300 Festividad Dr
- 22336 Festividad Dr
- 26801 Camargo Dr
- 26801 Espuma Dr
- 26808 Espuma Dr
- 22278 Festividad Dr
- 22342 Festividad Dr
- 26809 Espuma Dr
- 26811 Camargo Dr
- 26800 Alcon Dr
- 22272 Festividad Dr
- 22348 Festividad Dr
- 26814 Espuma Dr
- 22309 Paraguay Dr
- 22315 Paraguay Dr