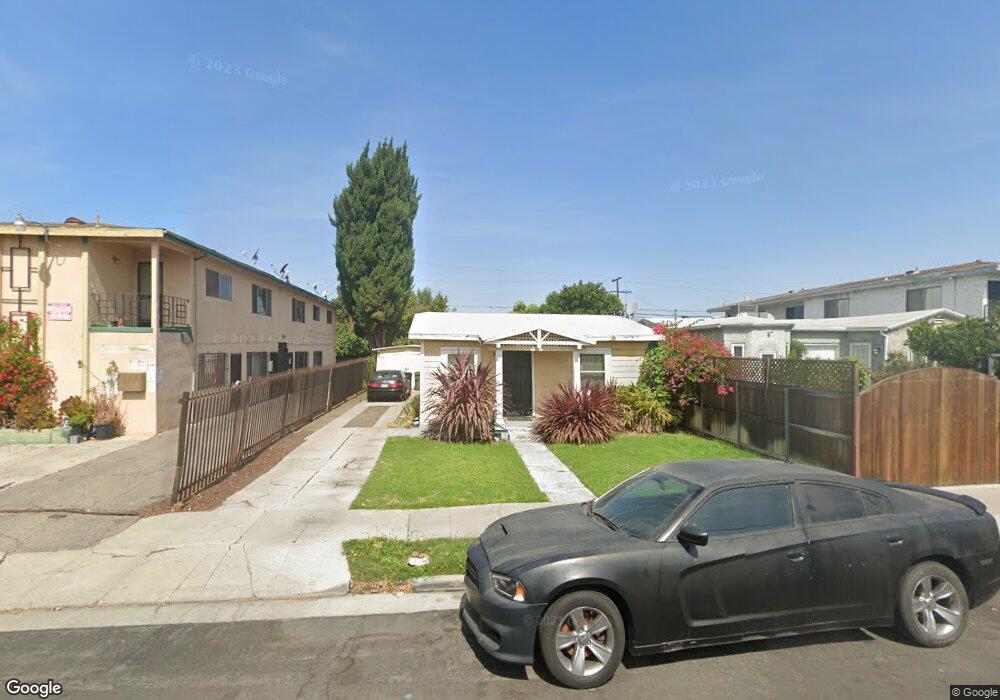
2233 S Burnside Ave Los Angeles, CA 90016
Mid-City NeighborhoodEstimated Value: $781,000 - $931,000
2
Beds
1
Bath
744
Sq Ft
$1,142/Sq Ft
Est. Value
About This Home
This home is located at 2233 S Burnside Ave, Los Angeles, CA 90016 and is currently estimated at $849,777, approximately $1,142 per square foot. 2233 S Burnside Ave is a home located in Los Angeles County with nearby schools including Marvin Avenue Elementary School, Daniel Webster Middle School, and Susan Miller Dorsey Senior High School.
Ownership History
Date
Name
Owned For
Owner Type
Purchase Details
Closed on
Sep 29, 2017
Sold by
Sandoval Jennifer M
Bought by
Sandoval Jennifer Melissa and The Jm Sandoval Family Trust
Current Estimated Value
Purchase Details
Closed on
Apr 28, 2010
Sold by
Wade Ruth Ethline
Bought by
Sandoval Jennifer M
Home Financials for this Owner
Home Financials are based on the most recent Mortgage that was taken out on this home.
Original Mortgage
$168,000
Interest Rate
4.82%
Mortgage Type
New Conventional
Purchase Details
Closed on
Nov 18, 1997
Sold by
Securit Pacific National Bank
Bought by
Wade Joyce Ruth E
Home Financials for this Owner
Home Financials are based on the most recent Mortgage that was taken out on this home.
Original Mortgage
$94,632
Interest Rate
7.19%
Mortgage Type
FHA
Purchase Details
Closed on
Nov 25, 1996
Sold by
Jones Matthew A
Bought by
Security Pacific National Bank and Greenwich Capital Acceptance Inc Series
Create a Home Valuation Report for This Property
The Home Valuation Report is an in-depth analysis detailing your home's value as well as a comparison with similar homes in the area
Home Values in the Area
Average Home Value in this Area
Purchase History
| Date | Buyer | Sale Price | Title Company |
|---|---|---|---|
| Sandoval Jennifer Melissa | -- | None Available | |
| Sandoval Jennifer M | $210,000 | North American Title Company | |
| Wade Joyce Ruth E | $95,000 | Fidelity Title | |
| Security Pacific National Bank | $90,080 | Fidelity National Title Ins |
Source: Public Records
Mortgage History
| Date | Status | Borrower | Loan Amount |
|---|---|---|---|
| Previous Owner | Sandoval Jennifer M | $168,000 | |
| Previous Owner | Wade Joyce Ruth E | $94,632 |
Source: Public Records
Tax History Compared to Growth
Tax History
| Year | Tax Paid | Tax Assessment Tax Assessment Total Assessment is a certain percentage of the fair market value that is determined by local assessors to be the total taxable value of land and additions on the property. | Land | Improvement |
|---|---|---|---|---|
| 2025 | $4,376 | $348,504 | $278,808 | $69,696 |
| 2024 | $4,376 | $341,672 | $273,342 | $68,330 |
| 2023 | $4,298 | $334,974 | $267,983 | $66,991 |
| 2022 | $4,108 | $328,407 | $262,729 | $65,678 |
| 2021 | $4,056 | $321,969 | $257,578 | $64,391 |
| 2019 | $3,939 | $312,421 | $249,939 | $62,482 |
| 2018 | $3,829 | $306,296 | $245,039 | $61,257 |
| 2016 | $3,663 | $294,404 | $235,525 | $58,879 |
| 2015 | $3,611 | $289,983 | $231,988 | $57,995 |
| 2014 | $3,632 | $284,303 | $227,444 | $56,859 |
Source: Public Records
Map
Nearby Homes
- 2201 S Ridgeley Dr
- 2342 S Cochran Ave
- 2419 S Cochran Ave
- 2108 Hauser Blvd
- 2435 S Dunsmuir Ave
- 2404 S Cochran Ave
- 2226 Hauser Blvd
- 2406 S Cochran Ave
- 2430 S Cochran Ave
- 2046 S Burnside Ave
- 2235 Hauser Blvd
- 2301 Hauser Blvd
- 2037 S Burnside Ave
- 2309 Hauser Blvd
- 2525 S Cochran Ave
- 2133 Cloverdale Ave
- 2230 S Redondo Blvd
- 2323 Carmona Ave
- 2116 S Cloverdale Ave
- 2531 Hauser Blvd
- 2229 S Burnside Ave
- 2237 S Burnside Ave
- 2225 S Burnside Ave
- 2225 S Burnside Ave Unit 1
- 2225 S Burnside Ave Unit 4
- 2225 S Burnside Ave
- 2241 S Burnside Ave
- 2221 S Burnside Ave
- 2245 S Burnside Ave
- 2223 S Burnside Ave
- 2301 S Burnside Ave
- 2212 S Ridgeley Dr
- 2217 S Burnside Ave
- 2228 S Burnside Ave
- 2232 S Burnside Ave
- 2224 S Burnside Ave
- 2236 S Burnside Ave Unit 2236.5
- 2236 S Burnside Ave
- 2232 S Ridgeley Dr
- 2220 S Burnside Ave