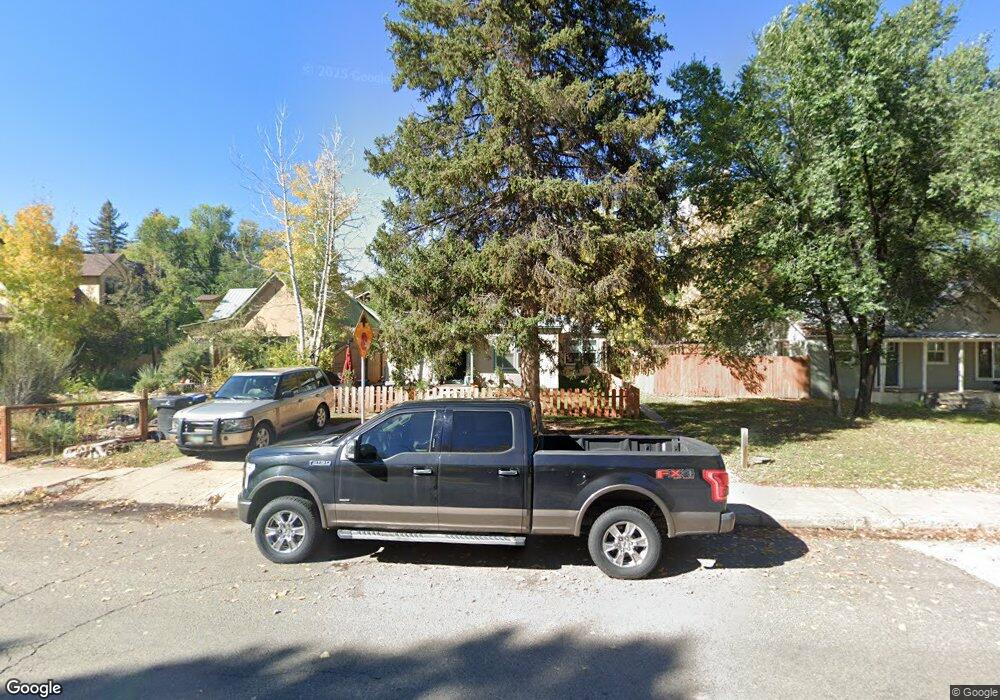
2233 W 2nd Ave Durango, CO 81301
West Avenues NeighborhoodEstimated Value: $734,000 - $842,433
4
Beds
2
Baths
1,729
Sq Ft
$452/Sq Ft
Est. Value
About This Home
This home is located at 2233 W 2nd Ave, Durango, CO 81301 and is currently estimated at $780,858, approximately $451 per square foot. 2233 W 2nd Ave is a home located in La Plata County with nearby schools including Needham Elementary School, Miller Middle School, and Durango High School.
Ownership History
Date
Name
Owned For
Owner Type
Purchase Details
Closed on
Sep 6, 1996
Bought by
Fredrick Charles P
Current Estimated Value
Create a Home Valuation Report for This Property
The Home Valuation Report is an in-depth analysis detailing your home's value as well as a comparison with similar homes in the area
Home Values in the Area
Average Home Value in this Area
Purchase History
| Date | Buyer | Sale Price | Title Company |
|---|---|---|---|
| Fredrick Charles P | -- | -- |
Source: Public Records
Tax History
| Year | Tax Paid | Tax Assessment Tax Assessment Total Assessment is a certain percentage of the fair market value that is determined by local assessors to be the total taxable value of land and additions on the property. | Land | Improvement |
|---|---|---|---|---|
| 2025 | $1,864 | $47,980 | $15,260 | $32,720 |
| 2024 | $1,586 | $39,450 | $11,260 | $28,190 |
| 2023 | $1,586 | $42,540 | $12,140 | $30,400 |
| 2022 | $1,357 | $43,770 | $12,490 | $31,280 |
| 2021 | $1,393 | $35,100 | $10,970 | $24,130 |
| 2020 | $1,286 | $33,460 | $10,810 | $22,650 |
| 2019 | $1,230 | $33,460 | $10,810 | $22,650 |
| 2018 | $1,162 | $31,980 | $10,300 | $21,680 |
| 2017 | $1,136 | $31,980 | $10,300 | $21,680 |
| 2016 | $1,047 | $32,110 | $9,820 | $22,290 |
| 2015 | $980 | $32,110 | $9,820 | $22,290 |
| 2014 | -- | $24,750 | $9,440 | $15,310 |
| 2013 | -- | $24,750 | $9,440 | $15,310 |
Source: Public Records
Map
Nearby Homes
- 362 W 23rd St
- 2024 W 2nd Ave
- 1867 W 2nd Ave
- 1857 & 1865 W 3rd Ave
- 1840 W 3rd Ave
- 485 Florida Rd Unit B-15
- 485 Florida Rd Unit C23
- 138 Riverview Dr
- 31 La Plata Place
- 416 W 28th St
- 2400 Arroyo Dr Unit 22
- TBD - Lot G Highway 550
- TBD (Tract C) Highway 550
- 49789 Highway 550
- 18 Miller Dr
- 1404 E 3rd Ave
- 1201 Main Ave Unit 105
- 3015 Hillside Ave
- 2718 New Mexico Ave Unit D
- 12 Falcon Way
- 2255 W 2nd Ave
- 2231 W 2nd Ave
- 2225 W 2nd Ave
- 203 W 22nd St
- 203 W 22nd St Unit 201 & 203 W. 22nd, 2
- 2270 W 3rd Ave
- 2208 W 3rd Ave
- 262 W 22nd St
- 2280 W 3rd Ave
- 2254 W 2nd Ave
- 2236 W 2nd Ave
- 2232 W 2nd Ave
- 2250 W 2nd Ave
- 264 W 22nd St
- 2220 W 2nd Ave
- 250 W 23rd St
- 179 W 22nd St
- 2256 W 2nd Ave
- 161 W 22nd St
- 2300 W 3rd Ave
Your Personal Tour Guide
Ask me questions while you tour the home.