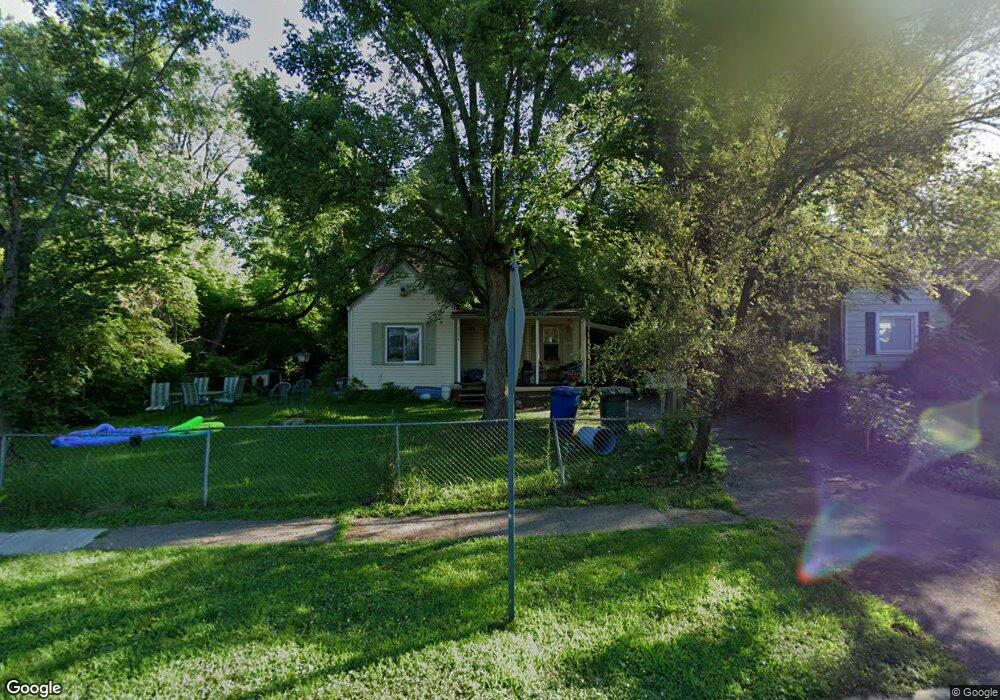
2234 Argyle Dr Columbus, OH 43219
Brittany Hills NeighborhoodEstimated Value: $145,000 - $189,000
3
Beds
1
Bath
1,072
Sq Ft
$154/Sq Ft
Est. Value
About This Home
This home is located at 2234 Argyle Dr, Columbus, OH 43219 and is currently estimated at $165,428, approximately $154 per square foot. 2234 Argyle Dr is a home located in Franklin County with nearby schools including South Mifflin Stem Academy (K-6), Linden-Mckinley Stem School On Arcadia, and Cesar Chavez College Preparatory School.
Ownership History
Date
Name
Owned For
Owner Type
Purchase Details
Closed on
Mar 19, 2024
Sold by
Shotwell Matthew D
Bought by
Shotwell Rachel V
Current Estimated Value
Home Financials for this Owner
Home Financials are based on the most recent Mortgage that was taken out on this home.
Original Mortgage
$68,000
Outstanding Balance
$66,671
Interest Rate
6.9%
Mortgage Type
New Conventional
Estimated Equity
$98,757
Purchase Details
Closed on
May 30, 2001
Sold by
Mcelroy Jobbie and Mcelroy Melita
Bought by
Shotwell Matthew D and Shotwell Rachel V
Purchase Details
Closed on
Oct 8, 1987
Bought by
Mcelroy Jobbie and Mcelroy Melita
Create a Home Valuation Report for This Property
The Home Valuation Report is an in-depth analysis detailing your home's value as well as a comparison with similar homes in the area
Home Values in the Area
Average Home Value in this Area
Purchase History
| Date | Buyer | Sale Price | Title Company |
|---|---|---|---|
| Shotwell Rachel V | -- | Landsel Title Agency | |
| Shotwell Matthew D | $74,900 | -- | |
| Mcelroy Jobbie | $35,500 | -- |
Source: Public Records
Mortgage History
| Date | Status | Borrower | Loan Amount |
|---|---|---|---|
| Open | Shotwell Rachel V | $68,000 |
Source: Public Records
Tax History
| Year | Tax Paid | Tax Assessment Tax Assessment Total Assessment is a certain percentage of the fair market value that is determined by local assessors to be the total taxable value of land and additions on the property. | Land | Improvement |
|---|---|---|---|---|
| 2025 | $1,576 | $35,110 | $8,650 | $26,460 |
| 2024 | $1,576 | $35,110 | $8,650 | $26,460 |
| 2023 | $1,556 | $35,105 | $8,645 | $26,460 |
| 2022 | $1,020 | $19,670 | $3,010 | $16,660 |
| 2021 | $1,022 | $19,670 | $3,010 | $16,660 |
| 2020 | $1,023 | $19,670 | $3,010 | $16,660 |
| 2019 | $943 | $15,550 | $2,420 | $13,130 |
| 2018 | $1,019 | $15,550 | $2,420 | $13,130 |
| 2017 | $1,075 | $15,550 | $2,420 | $13,130 |
| 2016 | $1,208 | $18,240 | $3,150 | $15,090 |
| 2015 | $1,097 | $18,240 | $3,150 | $15,090 |
| 2014 | $1,100 | $18,240 | $3,150 | $15,090 |
| 2013 | $603 | $20,265 | $3,500 | $16,765 |
Source: Public Records
Map
Nearby Homes
- 2144 Toni St
- 2145 Argyle Dr
- 2131 Argyle Dr
- 1642 Marina Dr
- 1816 Brentnell Ave
- 1582 Vendome Dr S
- 2299 Holt Ave
- 2350 Edenburgh Dr S
- 2321 Dunning Ct
- 1477 Dove Dr
- 2459 Meredith Dr
- 2526 Queenswood Dr
- 1991 Woodland Ave
- 2054 Jermain Dr
- 0 Mock Rd
- 1862 Argyle Dr
- 1331 Woodnell Ave
- 0 Danby Dr
- 2080 Parkwood Ave Unit 2090
- 2789 Sparrow Hill Dr Unit 18
- 2242 Argyle Dr
- 1731 Devonshire Rd
- 2218 Argyle Dr
- 1739 Devonshire Rd
- 1754 Brentnell Ave
- 1747 Devonshire Rd
- 2233 Argyle Dr
- 2250 Argyle Dr
- 1762 Brentnell Ave
- 2239 Argyle Dr
- 2225 Argyle Dr
- 1732 Devonshire Rd
- 1726 Devonshire Rd
- 1753 Devonshire Rd
- 2247 Argyle Dr
- 2258 Argyle Dr
- 2211 Argyle Dr
- 1770 Brentnell Ave
- 1738 Devonshire Rd
- 1741 Brentnell Ave
Your Personal Tour Guide
Ask me questions while you tour the home.