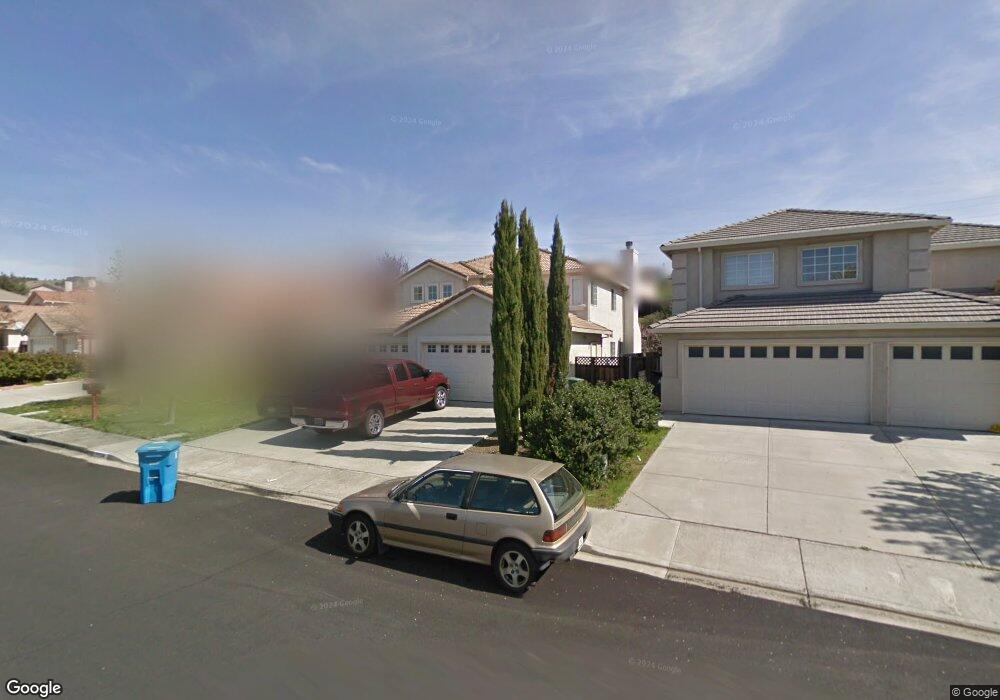
2234 Garnet Dr Vallejo, CA 94591
Northgate NeighborhoodEstimated Value: $669,000 - $739,000
4
Beds
3
Baths
2,246
Sq Ft
$314/Sq Ft
Est. Value
About This Home
This home is located at 2234 Garnet Dr, Vallejo, CA 94591 and is currently estimated at $705,489, approximately $314 per square foot. 2234 Garnet Dr is a home located in Solano County with nearby schools including Joseph H. Wardlaw Elementary School, Hogan Middle School, and Jesse M. Bethel High School.
Ownership History
Date
Name
Owned For
Owner Type
Purchase Details
Closed on
Aug 15, 2011
Sold by
Lofton Raymond
Bought by
Lofton Charles
Current Estimated Value
Purchase Details
Closed on
Nov 26, 2002
Sold by
Alesna Sancho K and Alesna Lerma B
Bought by
Lofton Charles and Lofton Raymond D
Home Financials for this Owner
Home Financials are based on the most recent Mortgage that was taken out on this home.
Original Mortgage
$340,000
Interest Rate
6.75%
Purchase Details
Closed on
Oct 29, 1998
Sold by
Mission Development
Bought by
Alesna Sancho K and Alesma Lerma B
Home Financials for this Owner
Home Financials are based on the most recent Mortgage that was taken out on this home.
Original Mortgage
$177,400
Interest Rate
6.6%
Create a Home Valuation Report for This Property
The Home Valuation Report is an in-depth analysis detailing your home's value as well as a comparison with similar homes in the area
Home Values in the Area
Average Home Value in this Area
Purchase History
| Date | Buyer | Sale Price | Title Company |
|---|---|---|---|
| Lofton Charles | $549,000 | None Available | |
| Lofton Charles | $425,000 | Placer Title Company | |
| Alesna Sancho K | $237,000 | First American Title Guarant |
Source: Public Records
Mortgage History
| Date | Status | Borrower | Loan Amount |
|---|---|---|---|
| Previous Owner | Lofton Charles | $340,000 | |
| Previous Owner | Alesna Sancho K | $177,400 | |
| Closed | Alesna Sancho K | $47,300 | |
| Closed | Lofton Charles | $63,750 |
Source: Public Records
Tax History
| Year | Tax Paid | Tax Assessment Tax Assessment Total Assessment is a certain percentage of the fair market value that is determined by local assessors to be the total taxable value of land and additions on the property. | Land | Improvement |
|---|---|---|---|---|
| 2025 | $7,746 | $489,132 | $101,044 | $388,088 |
| 2024 | $7,746 | $479,542 | $99,063 | $380,479 |
| 2023 | $7,411 | $470,140 | $97,121 | $373,019 |
| 2022 | $7,332 | $460,922 | $95,217 | $365,705 |
| 2021 | $7,199 | $451,885 | $93,350 | $358,535 |
| 2020 | $7,246 | $447,252 | $92,393 | $354,859 |
| 2019 | $7,083 | $438,483 | $90,582 | $347,901 |
| 2018 | $6,724 | $429,886 | $88,806 | $341,080 |
| 2017 | $6,491 | $421,458 | $87,065 | $334,393 |
| 2016 | $5,923 | $413,195 | $85,358 | $327,837 |
| 2015 | $5,860 | $406,989 | $84,076 | $322,913 |
| 2014 | $5,157 | $344,000 | $62,000 | $282,000 |
Source: Public Records
Map
Nearby Homes
- 2163 Garnet Cir
- 8405 Benavente Ct
- 6067 Loire Ct
- 1146 Waltz Ct
- 373 Clydesdale Dr
- 6206 Pebble Beach Dr
- 9102 Cambridge Cir
- 367 Darley Dr
- 9216 Hallmark Place
- 4134 Penny Ln
- 278 Cadloni Ln
- 4288 Melody Ln
- 1118 Waltz Ct
- 103 Stageline Ct
- 2890 Redwood Pkwy Unit 61
- 5830 Cabernet Dr
- 124 Gregory Ln
- 6996 Mortara Ct
- 5862 Cabernet Dr
- 272 Woodridge Dr
- 2236 Garnet Dr
- 2232 Garnet Dr
- 2238 Garnet Dr
- 2230 Garnet Dr
- 2155 Garnet Cir
- 2151 Garnet Cir
- 2159 Garnet Cir
- 2147 Garnet Cir
- 2240 Garnet Dr
- 2228 Garnet Dr
- 2233 Garnet Dr
- 2235 Garnet Dr
- 2231 Garnet Dr
- 2242 Garnet Dr
- 2239 Garnet Dr
- 2229 Garnet Dr
- 2226 Garnet Dr
- 2135 Garnet Cir
- 2167 Garnet Cir
- 2241 Garnet Dr
Your Personal Tour Guide
Ask me questions while you tour the home.