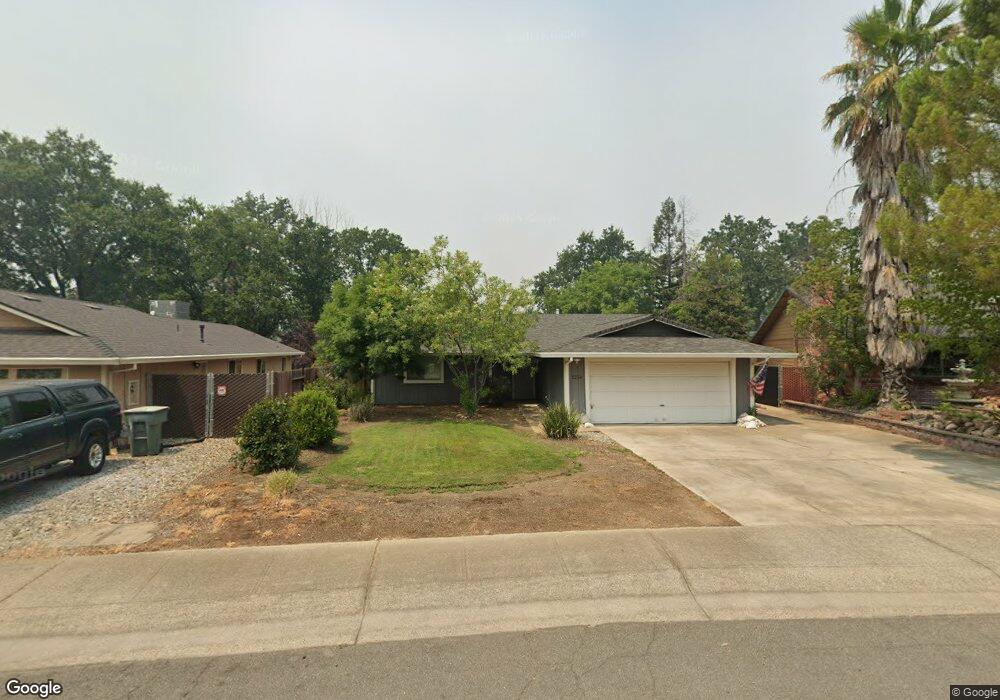
2234 Jessica Way Unit 1 Redding, CA 96002
Shasta View NeighborhoodEstimated Value: $342,000 - $370,054
3
Beds
2
Baths
1,320
Sq Ft
$268/Sq Ft
Est. Value
About This Home
This home is located at 2234 Jessica Way Unit 1, Redding, CA 96002 and is currently estimated at $353,764, approximately $268 per square foot. 2234 Jessica Way Unit 1 is a home located in Shasta County with nearby schools including Shasta Meadows Elementary School, Parsons Junior High School, and Enterprise High School.
Ownership History
Date
Name
Owned For
Owner Type
Purchase Details
Closed on
Aug 23, 2021
Sold by
Claborn James Cody and Claborn Leona Rose
Bought by
Boster Johnathan M
Current Estimated Value
Home Financials for this Owner
Home Financials are based on the most recent Mortgage that was taken out on this home.
Original Mortgage
$314,925
Outstanding Balance
$285,497
Interest Rate
2.7%
Mortgage Type
New Conventional
Estimated Equity
$68,267
Purchase Details
Closed on
Sep 7, 2000
Sold by
Kropp Thomas and Kropp Rena
Bought by
Claborn James Cody and Claborn Leona Rose
Home Financials for this Owner
Home Financials are based on the most recent Mortgage that was taken out on this home.
Original Mortgage
$98,894
Interest Rate
7.98%
Mortgage Type
FHA
Purchase Details
Closed on
Nov 3, 1997
Sold by
Kirk Neil and Kirk Dana
Bought by
Thomas Martin C and Thomas Ginny L
Create a Home Valuation Report for This Property
The Home Valuation Report is an in-depth analysis detailing your home's value as well as a comparison with similar homes in the area
Home Values in the Area
Average Home Value in this Area
Purchase History
| Date | Buyer | Sale Price | Title Company |
|---|---|---|---|
| Boster Johnathan M | $331,500 | Placer Title Company | |
| Claborn James Cody | $100,500 | Fidelity National Title Co | |
| Thomas Martin C | $36,000 | Fidelity National Title Co |
Source: Public Records
Mortgage History
| Date | Status | Borrower | Loan Amount |
|---|---|---|---|
| Open | Boster Johnathan M | $314,925 | |
| Previous Owner | Claborn James Cody | $98,894 | |
| Closed | Claborn James Cody | $5,010 |
Source: Public Records
Tax History Compared to Growth
Tax History
| Year | Tax Paid | Tax Assessment Tax Assessment Total Assessment is a certain percentage of the fair market value that is determined by local assessors to be the total taxable value of land and additions on the property. | Land | Improvement |
|---|---|---|---|---|
| 2025 | $3,738 | $351,789 | $53,060 | $298,729 |
| 2024 | $3,685 | $344,892 | $52,020 | $292,872 |
| 2023 | $3,685 | $338,130 | $51,000 | $287,130 |
| 2022 | $3,579 | $331,500 | $50,000 | $281,500 |
| 2021 | $1,461 | $139,469 | $30,616 | $108,853 |
| 2020 | $1,454 | $138,040 | $30,303 | $107,737 |
| 2019 | $1,441 | $135,334 | $29,709 | $105,625 |
| 2018 | $1,422 | $132,681 | $29,127 | $103,554 |
| 2017 | $1,445 | $130,080 | $28,556 | $101,524 |
| 2016 | $1,351 | $127,531 | $27,997 | $99,534 |
| 2015 | $1,339 | $125,616 | $27,577 | $98,039 |
| 2014 | $1,328 | $123,156 | $27,037 | $96,119 |
Source: Public Records
Map
Nearby Homes
- 2308 Hawn Ave
- 2531 Rainbow Ln
- 2399 Jonquil Way
- 3340 Hartnell Ave
- 2796 Kenco Ave
- 1703 Cascade Ln
- 2030 Hedgerow Ave
- 2681 Hartnell Ave
- 1535 E Cypress Ave
- Stacey Plan at Sonata
- Caroline Plan at Sonata
- Rosie Plan at Sonata
- Leah Plan at Sonata
- 2293 Milano Trail
- 1945 Salzburg Trail
- 0 Shasta View Unit 25-1945
- 3149 Leonard St
- 3361 Alta Mesa Dr
- 1565 Becky Way
- 2912 Squire Ave
- 2234 Jessica Way
- 2226 Jessica Way
- 2242 Jessica Way
- 2218 Jessica Way
- 2250 Jessica Way
- 0 Jessica Way
- 2210 Jessica Way
- 2233 Jessica Way
- 2247 Jessica Way
- 40 Acres Jennifer Rd
- 50 Acres Jennifer Dr
- 2262 Jessica Way
- 2221 Jessica Way
- 2202 Jessica Way
- 2213 Jessica Way
- 2205 Jessica Way
- 2196 Jessica Way
- 2261 Jessica Way
- 2274 Jessica Way
- 2254 Chelsa Cir