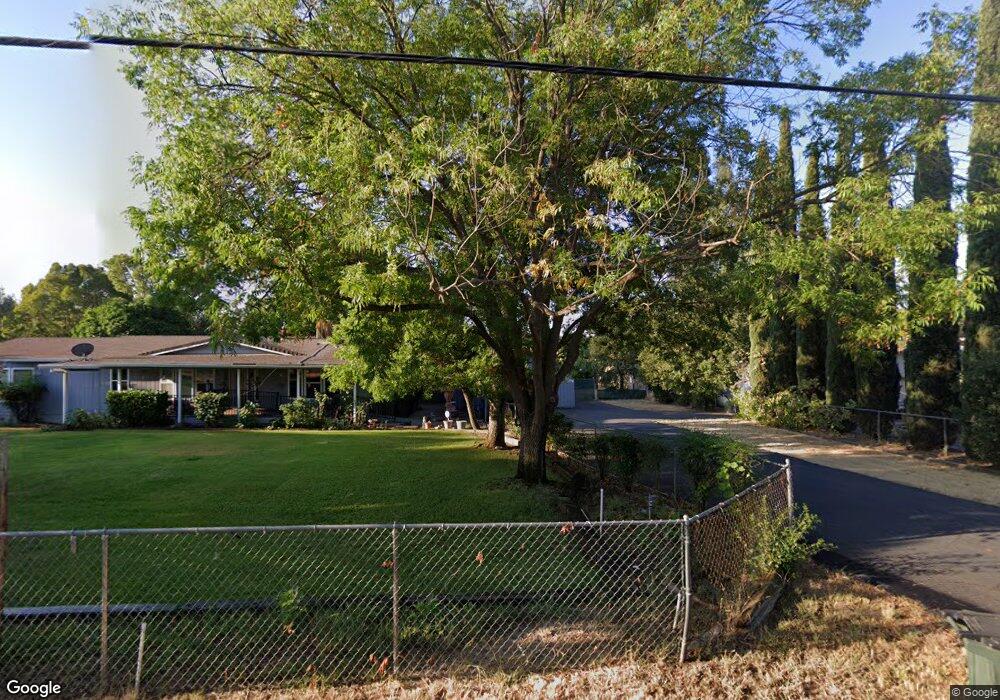
22345 Brent Rd Red Bluff, CA 96080
Estimated Value: $296,000 - $357,000
3
Beds
2
Baths
1,536
Sq Ft
$219/Sq Ft
Est. Value
About This Home
This home is located at 22345 Brent Rd, Red Bluff, CA 96080 and is currently estimated at $337,017, approximately $219 per square foot. 22345 Brent Rd is a home located in Tehama County with nearby schools including Evergreen Elementary School, Evergreen Middle School, and Red Bluff High School.
Ownership History
Date
Name
Owned For
Owner Type
Purchase Details
Closed on
Apr 19, 2021
Sold by
Williams Sandra Jan
Bought by
Williams Family Trust and Williams
Current Estimated Value
Purchase Details
Closed on
Dec 18, 2014
Sold by
Williams Ronald Brian
Bought by
Williams Family Trust
Purchase Details
Closed on
Mar 21, 2014
Sold by
Williams Ronald Brian and Williams Ronald B
Bought by
Williams Ronald Brian
Purchase Details
Closed on
Jun 6, 2007
Sold by
Bidinost Richard Frank and Bidinost Karen June
Bought by
Williams Ronald B
Purchase Details
Closed on
Jul 19, 2004
Sold by
Bidinost Richard F and Bidinost Karen J
Bought by
Bidinost Richard Frank and Bidinost Karen June
Purchase Details
Closed on
Apr 22, 2004
Sold by
Ward Wayne and Ward Ada
Bought by
Bidinost Richard F and Bidinost Karen J
Purchase Details
Closed on
Jan 2, 2001
Sold by
Musgrave Dorothy D
Bought by
Ward Wayne and Ward Ada
Create a Home Valuation Report for This Property
The Home Valuation Report is an in-depth analysis detailing your home's value as well as a comparison with similar homes in the area
Purchase History
| Date | Buyer | Sale Price | Title Company |
|---|---|---|---|
| Williams Family Trust | -- | -- | |
| Williams Family Trust | -- | None Available | |
| Williams Ronald Brian | -- | None Available | |
| Williams Ronald B | $275,000 | Fidelity National Title Comp | |
| Bidinost Richard Frank | -- | -- | |
| Bidinost Richard F | $180,000 | Fidelity National Title | |
| Ward Wayne | $98,000 | Fidelity National Title Co |
Source: Public Records
Tax History
| Year | Tax Paid | Tax Assessment Tax Assessment Total Assessment is a certain percentage of the fair market value that is determined by local assessors to be the total taxable value of land and additions on the property. | Land | Improvement |
|---|---|---|---|---|
| 2025 | $3,101 | $306,204 | $172,588 | $133,616 |
| 2023 | $3,120 | $306,204 | $172,588 | $133,616 |
| 2022 | $3,091 | $306,204 | $172,588 | $133,616 |
| 2021 | $2,811 | $278,367 | $156,898 | $121,469 |
| 2020 | $2,461 | $242,058 | $136,433 | $105,625 |
| 2019 | $2,379 | $230,531 | $129,936 | $100,595 |
| 2018 | $2,099 | $209,574 | $118,124 | $91,450 |
| 2017 | $1,958 | $190,521 | $107,385 | $83,136 |
| 2016 | $1,774 | $181,448 | $102,271 | $79,177 |
| 2015 | $1,772 | $181,448 | $102,271 | $79,177 |
| 2014 | $1,542 | $157,782 | $88,932 | $68,850 |
Source: Public Records
Map
Nearby Homes
- 22425 Brent Rd
- 22275 Brent Rd
- 22363 Canta Del Rio Ln
- 22400 Vía Pasado
- 22165 Davis Rd
- 15470 China Rapids Dr
- 15460 China Rapids Dr
- 16475 River Heights Dr
- 16150 Jellys Ferry Rd
- 16105 Julie Ln
- 21735 Hidy Way
- 0 Wood Duck Pass Unit ML82037498
- 22611 Adobe Rd
- 108 Lot 8 of Tract No 91-1002 Ln
- 22560 Adobe Rd
- 000 Knob Hill Place
- 00000 Sunriver Dr
- 00JB Old Mission Dr
- 15775 Skyline Dr
- 14435 Del Oro Ct
- 22325 Brent Rd
- 22350 Brent Rd
- 22300 Brent Rd
- 22295 Brent Rd
- 15800 E Wallen Rd
- Lot 9 Canta Del Rio Ln
- 22280 Brent Rd
- 15840 Bosman Dr
- 22429 Brent Rd
- 22270 Brent Rd
- 22395 Canta Del Rio Ln
- 22435 Brent Rd
- 22385 Canta Del Rio Ln
- 22260 Brent Rd
- 22445 Brent Rd
- 15820 E Wallen Rd
- 22455 Brent Rd
- 15850 E Wallen Rd
- 15960 Rivermist Ln
- 22240 Brent Rd
Your Personal Tour Guide
Ask me questions while you tour the home.