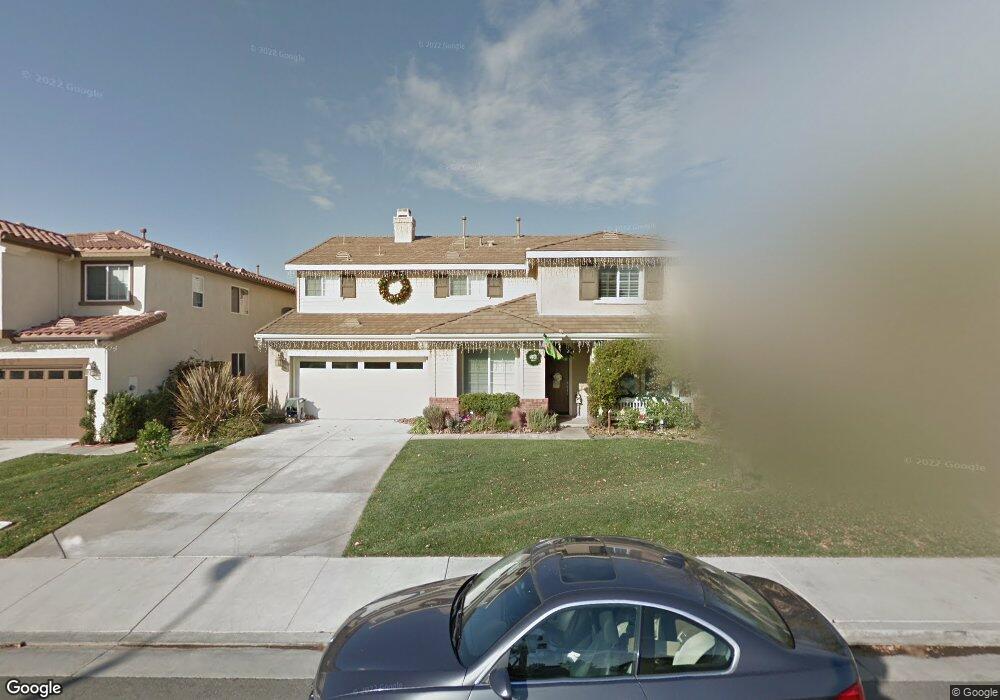
22349 Homestead Place Santa Clarita, CA 91350
Saugus NeighborhoodEstimated Value: $983,530 - $1,021,000
5
Beds
3
Baths
2,962
Sq Ft
$338/Sq Ft
Est. Value
About This Home
This home is located at 22349 Homestead Place, Santa Clarita, CA 91350 and is currently estimated at $1,002,383, approximately $338 per square foot. 22349 Homestead Place is a home located in Los Angeles County with nearby schools including James Foster Elementary School, Arroyo Seco Junior High School, and Saugus High School.
Ownership History
Date
Name
Owned For
Owner Type
Purchase Details
Closed on
Oct 24, 2003
Sold by
Greystone Homes Inc
Bought by
Gump Robert J and Gump Tamera A
Current Estimated Value
Home Financials for this Owner
Home Financials are based on the most recent Mortgage that was taken out on this home.
Original Mortgage
$392,000
Outstanding Balance
$175,494
Interest Rate
5.62%
Mortgage Type
Purchase Money Mortgage
Estimated Equity
$826,889
Purchase Details
Closed on
Jun 11, 2003
Sold by
Lenone Inc
Bought by
Greystone Homes Inc
Purchase Details
Closed on
May 29, 2002
Sold by
Clarita Portfolio Llc
Bought by
Lenone Inc
Home Financials for this Owner
Home Financials are based on the most recent Mortgage that was taken out on this home.
Original Mortgage
$10,128,710
Interest Rate
6.89%
Purchase Details
Closed on
Mar 26, 2002
Sold by
Pacific Bay Properties
Bought by
Clarita Portfolio Llc
Create a Home Valuation Report for This Property
The Home Valuation Report is an in-depth analysis detailing your home's value as well as a comparison with similar homes in the area
Home Values in the Area
Average Home Value in this Area
Purchase History
| Date | Buyer | Sale Price | Title Company |
|---|---|---|---|
| Gump Robert J | $491,000 | North American Title Co | |
| Greystone Homes Inc | -- | North American Title Co | |
| Lenone Inc | -- | North American Title Co | |
| Clarita Portfolio Llc | -- | Chicago Title Co |
Source: Public Records
Mortgage History
| Date | Status | Borrower | Loan Amount |
|---|---|---|---|
| Open | Gump Robert J | $392,000 | |
| Previous Owner | Lenone Inc | $10,128,710 | |
| Closed | Gump Robert J | $98,182 |
Source: Public Records
Tax History Compared to Growth
Tax History
| Year | Tax Paid | Tax Assessment Tax Assessment Total Assessment is a certain percentage of the fair market value that is determined by local assessors to be the total taxable value of land and additions on the property. | Land | Improvement |
|---|---|---|---|---|
| 2025 | $9,881 | $705,568 | $324,442 | $381,126 |
| 2024 | $9,881 | $691,734 | $318,081 | $373,653 |
| 2023 | $9,654 | $678,172 | $311,845 | $366,327 |
| 2022 | $9,700 | $664,876 | $305,731 | $359,145 |
| 2021 | $9,542 | $651,840 | $299,737 | $352,103 |
| 2019 | $9,229 | $632,508 | $290,848 | $341,660 |
| 2018 | $9,007 | $620,107 | $285,146 | $334,961 |
| 2016 | $8,444 | $596,029 | $274,074 | $321,955 |
| 2015 | $8,499 | $587,077 | $269,958 | $317,119 |
| 2014 | $8,380 | $575,578 | $264,670 | $310,908 |
Source: Public Records
Map
Nearby Homes
- 28251 Infinity Cir
- 22617 Copper Hill Dr Unit 121
- 22440 Skylake Place
- 28419 Hidden Hills Dr
- 28241 Tamarack Ln
- 27929 Dexter Dr
- 22713 Copper Hill Dr Unit 42
- 28321 Evergreen Ln
- 22045 Milestone St
- 28114 Seco Canyon Rd Unit 156
- 22035 Conway Place
- 22025 Lytle Ct
- 27829 Carnegie Ave
- 28123 Seco Canyon Rd Unit 94
- 28121 Seco Canyon Rd Unit 86
- 28345 Seco Canyon Rd Unit 97
- 28341 Seco Canyon Rd Unit 107
- 22839 Banyan Place Unit 334
- 27872 Cherry Creek Dr
- 28415 Seco Canyon Rd Unit 125
- 22355 Homestead Place
- 22343 Homestead Place
- 22361 Homestead Place
- 22337 Homestead Place
- 22348 Homestead Place
- 22331 Homestead Place
- 22342 Homestead Place
- 22354 Homestead Place
- 28210 Infinity Cir
- 28218 Infinity Cir
- 22336 Homestead Place
- 22367 Homestead Place
- 28202 Infinity Cir
- 22362 Homestead Place
- 28222 Infinity Cir
- 22327 Homestead Place
- 22330 Homestead Place
- 28224 Infinity Cir
- 22374 Homestead Place
- 22324 Homestead Place