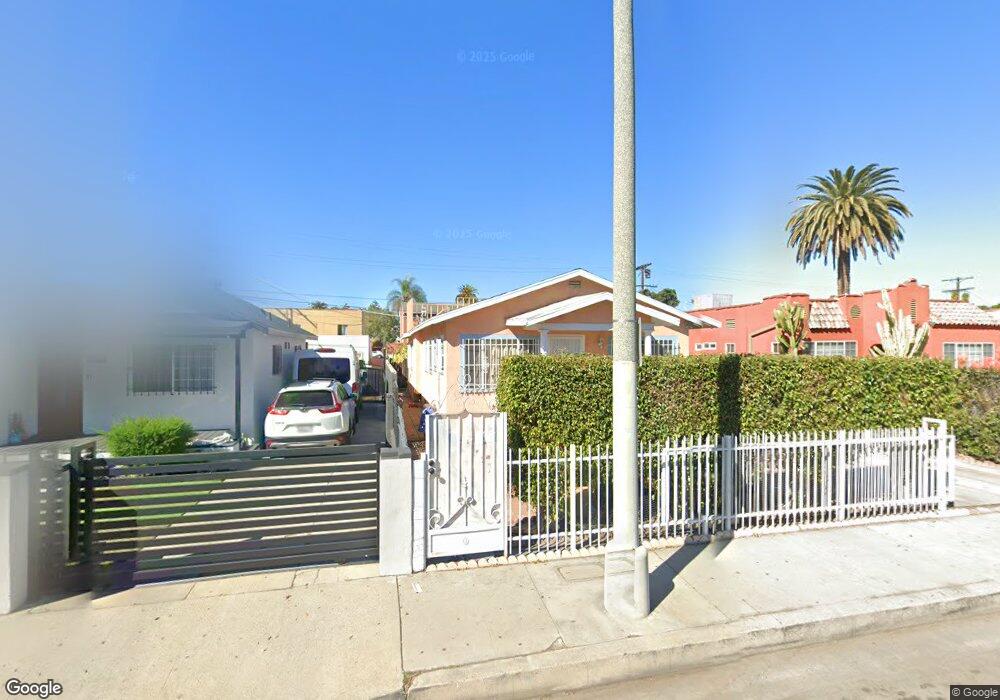
2235 S Redondo Blvd Los Angeles, CA 90016
Mid-City NeighborhoodEstimated Value: $828,000 - $993,000
3
Beds
1
Bath
1,090
Sq Ft
$834/Sq Ft
Est. Value
About This Home
This home is located at 2235 S Redondo Blvd, Los Angeles, CA 90016 and is currently estimated at $908,904, approximately $833 per square foot. 2235 S Redondo Blvd is a home located in Los Angeles County with nearby schools including Cienega Elementary School, Johnnie L. Cochran Jr. Middle School, and Susan Miller Dorsey Senior High School.
Ownership History
Date
Name
Owned For
Owner Type
Purchase Details
Closed on
Jun 11, 2016
Sold by
Velasquez Melvin S
Bought by
Velasquez Melvin S
Current Estimated Value
Home Financials for this Owner
Home Financials are based on the most recent Mortgage that was taken out on this home.
Original Mortgage
$312,000
Outstanding Balance
$248,641
Interest Rate
3.61%
Mortgage Type
New Conventional
Estimated Equity
$660,263
Purchase Details
Closed on
Dec 4, 2002
Sold by
Cal Kor Properties Inc
Bought by
Velasquez Melvin S
Home Financials for this Owner
Home Financials are based on the most recent Mortgage that was taken out on this home.
Original Mortgage
$7,500
Interest Rate
5.73%
Purchase Details
Closed on
Apr 24, 2002
Sold by
Brooks Jeanette
Bought by
Cal Kor Properties
Home Financials for this Owner
Home Financials are based on the most recent Mortgage that was taken out on this home.
Original Mortgage
$96,700
Interest Rate
6.6%
Create a Home Valuation Report for This Property
The Home Valuation Report is an in-depth analysis detailing your home's value as well as a comparison with similar homes in the area
Home Values in the Area
Average Home Value in this Area
Purchase History
| Date | Buyer | Sale Price | Title Company |
|---|---|---|---|
| Velasquez Melvin S | -- | Amc Settlement Services | |
| Velasquez Melvin S | $225,000 | Chicago Title | |
| Cal Kor Properties | $90,000 | -- |
Source: Public Records
Mortgage History
| Date | Status | Borrower | Loan Amount |
|---|---|---|---|
| Open | Velasquez Melvin S | $312,000 | |
| Previous Owner | Velasquez Melvin S | $7,500 | |
| Previous Owner | Cal Kor Properties | $96,700 | |
| Closed | Velasquez Melvin S | $202,500 |
Source: Public Records
Tax History Compared to Growth
Tax History
| Year | Tax Paid | Tax Assessment Tax Assessment Total Assessment is a certain percentage of the fair market value that is determined by local assessors to be the total taxable value of land and additions on the property. | Land | Improvement |
|---|---|---|---|---|
| 2025 | $4,115 | $328,591 | $263,917 | $64,674 |
| 2024 | $4,115 | $322,149 | $258,743 | $63,406 |
| 2023 | $4,042 | $315,833 | $253,670 | $62,163 |
| 2022 | $3,863 | $309,642 | $248,697 | $60,945 |
| 2021 | $3,810 | $303,571 | $243,821 | $59,750 |
| 2019 | $3,700 | $294,569 | $236,590 | $57,979 |
| 2018 | $3,633 | $288,794 | $231,951 | $56,843 |
| 2016 | $3,471 | $277,582 | $222,945 | $54,637 |
| 2015 | $3,421 | $273,414 | $219,597 | $53,817 |
| 2014 | $3,442 | $268,059 | $215,296 | $52,763 |
Source: Public Records
Map
Nearby Homes
- 2230 S Redondo Blvd
- 2133 Cloverdale Ave
- 2116 S Cloverdale Ave
- 2342 S Cochran Ave
- 5144 W 21st St
- 2404 S Cochran Ave
- 2406 S Cochran Ave
- 2046 S Burnside Ave
- 2419 S Cochran Ave
- 2430 S Cochran Ave
- 5154 W 20th St
- 2037 S Burnside Ave
- 5227 W 20th St
- 2235 S Mansfield Ave
- 2435 S Dunsmuir Ave
- 2524 Alsace Ave
- 2201 S Ridgeley Dr
- 2108 Hauser Blvd
- 2115 S Mansfield Ave
- 2525 S Cochran Ave
- 2239 S Redondo Blvd
- 2231 S Redondo Blvd
- 2243 S Redondo Blvd
- 2227 S Redondo Blvd
- 2249 S Redondo Blvd
- 2223 S Redondo Blvd
- 2232 S Cloverdale Ave
- 2236 S Cloverdale Ave
- 2242 S Cloverdale Ave
- 2226 S Cloverdale Ave
- 2219 1/2 S Redondo Blvd
- 2219 S Redondo Blvd
- 2248 S Cloverdale Ave
- 2222 S Cloverdale Ave
- 2230 S Redondo Blvd Unit 3
- 2230 S Redondo Blvd Unit 4
- 2234 S Redondo Blvd
- 2238 S Redondo Blvd
- 2242 S Redondo Blvd
- 2226 S Redondo Blvd