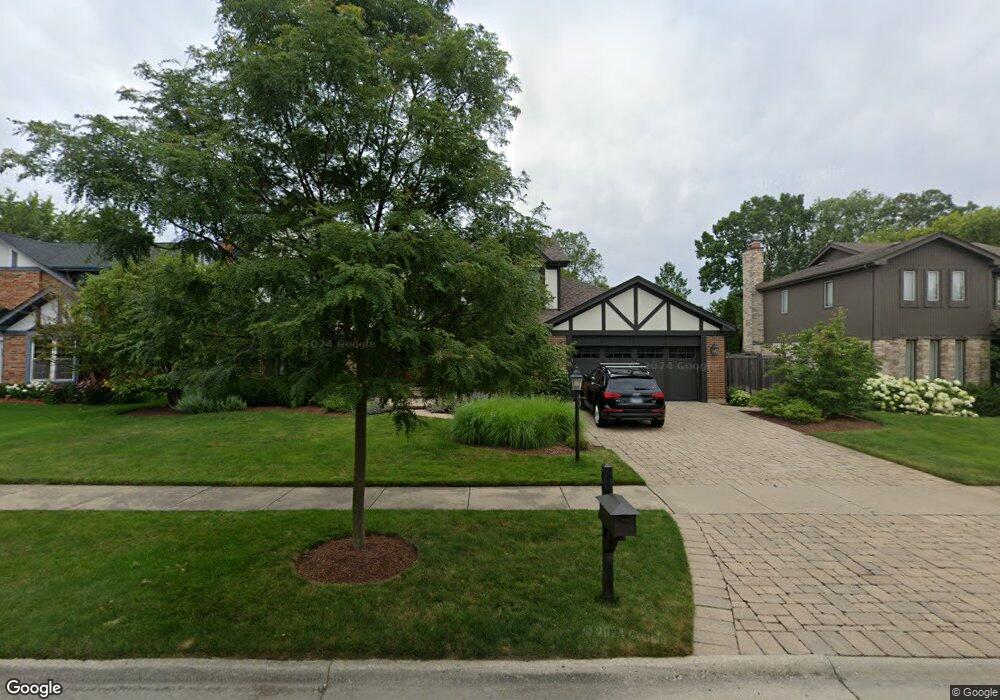
2237 Janet Dr Glenview, IL 60026
The Willows NeighborhoodEstimated Value: $862,000 - $1,022,000
4
Beds
3
Baths
2,807
Sq Ft
$331/Sq Ft
Est. Value
About This Home
This home is located at 2237 Janet Dr, Glenview, IL 60026 and is currently estimated at $930,519, approximately $331 per square foot. 2237 Janet Dr is a home located in Cook County with nearby schools including Willowbrook Elementary School, Maple School, and Glenbrook South High School.
Ownership History
Date
Name
Owned For
Owner Type
Purchase Details
Closed on
Aug 25, 2005
Sold by
Fair Thomas E and Fair Lynn B
Bought by
Falk Brian P and Falk Allison L
Current Estimated Value
Home Financials for this Owner
Home Financials are based on the most recent Mortgage that was taken out on this home.
Original Mortgage
$472,000
Outstanding Balance
$245,787
Interest Rate
5.82%
Mortgage Type
Fannie Mae Freddie Mac
Estimated Equity
$684,732
Purchase Details
Closed on
Oct 10, 1996
Sold by
Batchelder Kenneth T and Batchelder Patricia A
Bought by
Fair Thomas E and Fair Lynn B
Home Financials for this Owner
Home Financials are based on the most recent Mortgage that was taken out on this home.
Original Mortgage
$155,000
Interest Rate
6.62%
Create a Home Valuation Report for This Property
The Home Valuation Report is an in-depth analysis detailing your home's value as well as a comparison with similar homes in the area
Home Values in the Area
Average Home Value in this Area
Purchase History
| Date | Buyer | Sale Price | Title Company |
|---|---|---|---|
| Falk Brian P | $590,000 | Cst | |
| Fair Thomas E | $420,000 | -- |
Source: Public Records
Mortgage History
| Date | Status | Borrower | Loan Amount |
|---|---|---|---|
| Open | Falk Brian P | $472,000 | |
| Previous Owner | Fair Thomas E | $155,000 |
Source: Public Records
Tax History
| Year | Tax Paid | Tax Assessment Tax Assessment Total Assessment is a certain percentage of the fair market value that is determined by local assessors to be the total taxable value of land and additions on the property. | Land | Improvement |
|---|---|---|---|---|
| 2025 | $13,607 | $87,000 | $17,160 | $69,840 |
| 2024 | $13,607 | $62,054 | $14,560 | $47,494 |
| 2023 | $13,243 | $62,054 | $14,560 | $47,494 |
| 2022 | $13,243 | $62,054 | $14,560 | $47,494 |
| 2021 | $11,844 | $49,614 | $12,220 | $37,394 |
| 2020 | $11,741 | $49,614 | $12,220 | $37,394 |
| 2019 | $11,257 | $54,521 | $12,220 | $42,301 |
| 2018 | $11,944 | $52,793 | $10,660 | $42,133 |
| 2017 | $11,719 | $52,793 | $10,660 | $42,133 |
| 2016 | $11,839 | $57,397 | $10,660 | $46,737 |
| 2015 | $8,866 | $39,429 | $8,580 | $30,849 |
| 2014 | $8,717 | $39,429 | $8,580 | $30,849 |
| 2013 | $8,935 | $40,917 | $8,580 | $32,337 |
Source: Public Records
Map
Nearby Homes
- 2137 Dauntless Dr
- 3501 Lawson Rd
- 102 Yale Ct Unit 34LH10
- 2571 Essex Dr
- 3820 Kiess Dr
- 3100 Lexington Ln Unit 312
- 3800 Kiess Dr
- 2230 Goldenrod Ln
- 1615 Greenwood Rd
- 1605 Elmdale Ave
- 2050 Valencia Dr Unit 300C
- 2050 Valencia Dr Unit 405C
- 1867 Admiral Ct Unit 91
- 2464 Violet St
- 1813 Admiral Ct Unit 118
- 2408 Violet St
- 2701 Commons Dr Unit 210
- 4142 Hampton Ct
- 3849 Grace Ln
- 3190 Landwehr Rd
Your Personal Tour Guide
Ask me questions while you tour the home.