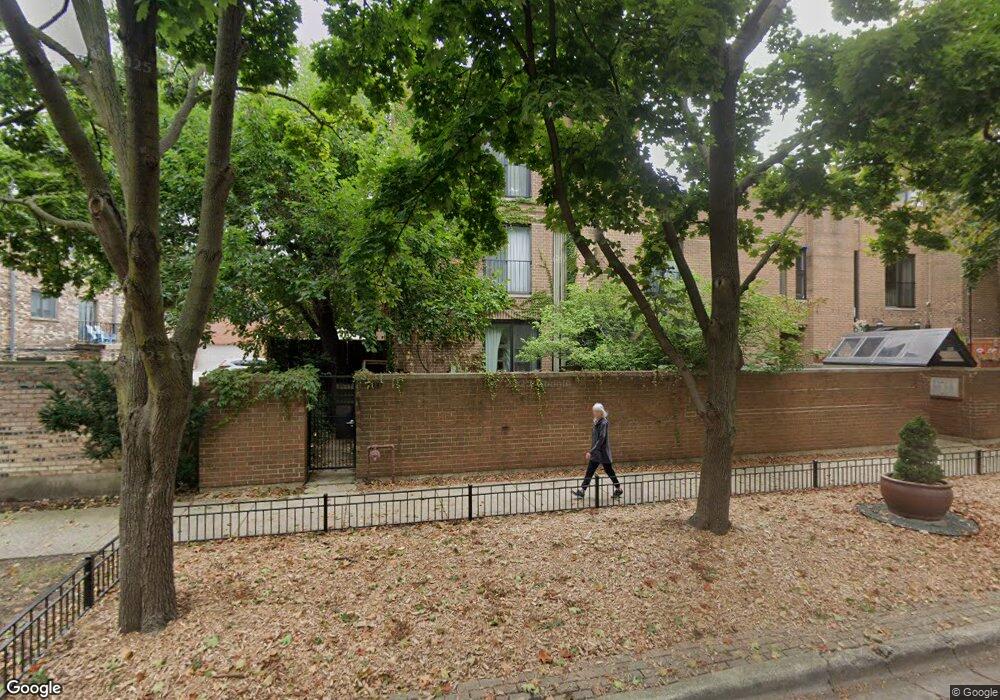
2237 N Lakewood Ave Unit EN Chicago, IL 60614
West DePaul NeighborhoodEstimated Value: $689,000 - $956,000
2
Beds
2
Baths
1,870
Sq Ft
$422/Sq Ft
Est. Value
About This Home
This home is located at 2237 N Lakewood Ave Unit EN, Chicago, IL 60614 and is currently estimated at $789,861, approximately $422 per square foot. 2237 N Lakewood Ave Unit EN is a home located in Cook County with nearby schools including Mayer Elementary School, Lincoln Park High School, and St Josaphat School.
Ownership History
Date
Name
Owned For
Owner Type
Purchase Details
Closed on
May 15, 2017
Sold by
Marsh A Don
Bought by
Caspari John M and Caspari Laura
Current Estimated Value
Home Financials for this Owner
Home Financials are based on the most recent Mortgage that was taken out on this home.
Original Mortgage
$395,625
Outstanding Balance
$324,587
Interest Rate
3.62%
Mortgage Type
Adjustable Rate Mortgage/ARM
Estimated Equity
$465,274
Purchase Details
Closed on
Aug 26, 2003
Sold by
Kuhlmann Frank A and Kuhlmann Erica T
Bought by
Marsh A Don
Home Financials for this Owner
Home Financials are based on the most recent Mortgage that was taken out on this home.
Original Mortgage
$270,000
Interest Rate
4.75%
Mortgage Type
Purchase Money Mortgage
Create a Home Valuation Report for This Property
The Home Valuation Report is an in-depth analysis detailing your home's value as well as a comparison with similar homes in the area
Home Values in the Area
Average Home Value in this Area
Purchase History
| Date | Buyer | Sale Price | Title Company |
|---|---|---|---|
| Caspari John M | $527,500 | Baird & Wamer Title Services | |
| Marsh A Don | $430,000 | Cti |
Source: Public Records
Mortgage History
| Date | Status | Borrower | Loan Amount |
|---|---|---|---|
| Open | Caspari John M | $395,625 | |
| Previous Owner | Marsh A Don | $270,000 |
Source: Public Records
Tax History Compared to Growth
Tax History
| Year | Tax Paid | Tax Assessment Tax Assessment Total Assessment is a certain percentage of the fair market value that is determined by local assessors to be the total taxable value of land and additions on the property. | Land | Improvement |
|---|---|---|---|---|
| 2024 | $10,395 | $64,987 | $20,685 | $44,302 |
| 2023 | $10,112 | $52,584 | $16,682 | $35,902 |
| 2022 | $10,112 | $52,584 | $16,682 | $35,902 |
| 2021 | $10,591 | $55,999 | $16,681 | $39,318 |
| 2020 | $10,455 | $50,034 | $14,679 | $35,355 |
| 2019 | $10,229 | $54,341 | $14,679 | $39,662 |
| 2018 | $10,734 | $54,341 | $14,679 | $39,662 |
| 2017 | $10,606 | $52,643 | $12,010 | $40,633 |
| 2016 | $10,044 | $52,643 | $12,010 | $40,633 |
| 2015 | $9,166 | $52,643 | $12,010 | $40,633 |
| 2014 | $8,449 | $48,109 | $9,008 | $39,101 |
| 2013 | $8,272 | $48,109 | $9,008 | $39,101 |
Source: Public Records
Map
Nearby Homes
- 1323 W Belden Ave Unit E1
- 2124 N Lakewood Ave
- 1408 W Belden Ave Unit 1
- 2300 N Southport Ave Unit 3C
- 2127 N Racine Ave Unit 2
- 1242 W Dickens Ave
- 2100 N Racine Ave Unit 4B
- 2435 N Clybourn Ave Unit 2S
- 2435 N Clybourn Ave Unit 2N
- 2435 N Clybourn Ave Unit 4S
- 2435 N Clybourn Ave Unit 3S
- 1359 W Fullerton Ave Unit PH
- 1728 N Clybourn Ave
- 1350 W Fullerton Ave Unit 405
- 2209 N Seminary Ave
- 2243 N Greenview Ave Unit D
- 2103 N Clifton Ave
- 2307 N Greenview Ave Unit 3
- 2116 N Seminary Ave Unit 28
- 2360 N Janssen Ave Unit 2D
- 2237 N Lakewood Ave Unit DN
- 2237 N Lakewood Ave Unit BN
- 2235 N Lakewood Ave Unit FN
- 2235 N Lakewood Ave Unit FS
- 2235 N Lakewood Ave Unit CN
- 2233 N Lakewood Ave Unit BS
- 2235 N Lakewood Ave Unit CS
- 2235 N Lakewood Ave Unit DS
- 2235 N Lakewood Ave Unit AN
- 2235 N Lakewood Ave Unit AS
- 2235 N Lakewood Ave Unit ES
- 2235 N Lakewood Ave Unit EN
- 2235 N Lakewood Ave
- 2235 N Lakewood Ave Unit DN
- 2235 N Lakewood Ave Unit BS
- 2247 N Lakewood Ave
- 2247 N Lakewood Ave
- 2247 N Lakewood Ave
- 2257 S Riverside Plaza
- 2249 N Lakewood Ave