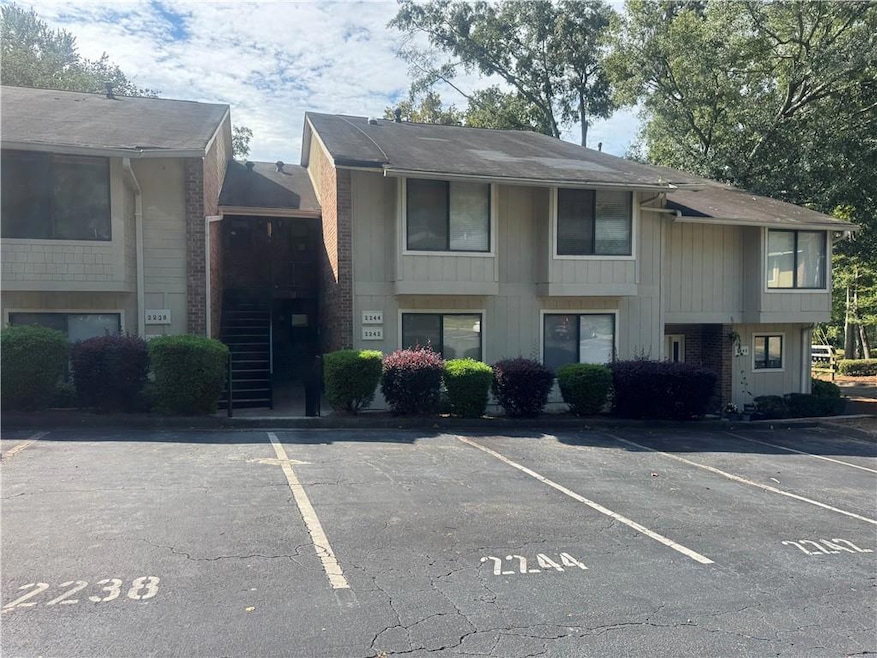


2238 Surrey Ct SE Marietta, GA 30067
Estimated payment $1,530/month
Highlights
- In Ground Pool
- Traditional Architecture
- Stone Countertops
- Marietta High School Rated A-
- Sun or Florida Room
- Neighborhood Views
About This Home
Move-in ready 2 bed / 2 bath condo in the highly sought-after Covered Bridge community of East Cobb! This second-story flat features fresh paint, granite countertops, updated flooring, and a private screened porch with wooded views. Covered Bridge offers swim/tennis, clubhouse, park, and private backyards (some fenced). Prime location near shopping, dining, and easy access to I-75/I-285. Two assigned parking spaces. Top Marietta schools: Lockheed Elementary, Marietta Middle, and Marietta High.
Property Details
Home Type
- Condominium
Est. Annual Taxes
- $780
Year Built
- Built in 1981
HOA Fees
- $325 Monthly HOA Fees
Home Design
- Traditional Architecture
- Brick Exterior Construction
- Composition Roof
Interior Spaces
- 1,320 Sq Ft Home
- 1-Story Property
- Roommate Plan
- Factory Built Fireplace
- Breakfast Room
- Sun or Florida Room
- Screened Porch
- Laminate Flooring
- Neighborhood Views
Kitchen
- Open to Family Room
- Eat-In Kitchen
- Breakfast Bar
- Electric Oven
- Dishwasher
- Kitchen Island
- Stone Countertops
Bedrooms and Bathrooms
- 2 Main Level Bedrooms
- 2 Full Bathrooms
Laundry
- Laundry Room
- Laundry in Hall
Home Security
Parking
- 2 Parking Spaces
- Assigned Parking
Location
- Property is near schools
- Property is near shops
Schools
- Lockheed Elementary School
- Marietta Middle School
- Marietta High School
Utilities
- Central Heating and Cooling System
- High Speed Internet
- Phone Available
- Cable TV Available
Additional Features
- In Ground Pool
- Two or More Common Walls
Listing and Financial Details
- Assessor Parcel Number 17079600650
Community Details
Overview
- 270 Units
- Covered Bridge Subdivision
Recreation
- Community Pool
Security
- Fire and Smoke Detector
Map
Home Values in the Area
Average Home Value in this Area
Tax History
| Year | Tax Paid | Tax Assessment Tax Assessment Total Assessment is a certain percentage of the fair market value that is determined by local assessors to be the total taxable value of land and additions on the property. | Land | Improvement |
|---|---|---|---|---|
| 2024 | $780 | $92,220 | $34,000 | $58,220 |
| 2023 | $780 | $92,220 | $34,000 | $58,220 |
| 2022 | $536 | $63,364 | $12,000 | $51,364 |
| 2021 | $510 | $59,376 | $12,000 | $47,376 |
| 2020 | $422 | $49,112 | $12,000 | $37,112 |
| 2019 | $422 | $49,112 | $12,000 | $37,112 |
| 2018 | $376 | $43,716 | $12,000 | $31,716 |
| 2017 | $234 | $34,000 | $7,720 | $26,280 |
| 2016 | $96 | $30,556 | $5,200 | $25,356 |
| 2015 | $103 | $24,112 | $4,000 | $20,112 |
| 2014 | $105 | $24,112 | $0 | $0 |
Property History
| Date | Event | Price | List to Sale | Price per Sq Ft | Prior Sale |
|---|---|---|---|---|---|
| 09/30/2025 09/30/25 | Price Changed | $215,000 | -1.8% | $163 / Sq Ft | |
| 09/15/2025 09/15/25 | Price Changed | $219,000 | -2.7% | $166 / Sq Ft | |
| 09/02/2025 09/02/25 | For Sale | $225,000 | 0.0% | $170 / Sq Ft | |
| 11/17/2021 11/17/21 | Rented | $1,500 | 0.0% | -- | |
| 11/06/2021 11/06/21 | For Rent | $1,500 | +22.4% | -- | |
| 11/09/2019 11/09/19 | Rented | $1,225 | 0.0% | -- | |
| 11/05/2019 11/05/19 | For Rent | $1,225 | 0.0% | -- | |
| 10/18/2019 10/18/19 | Rented | $1,225 | 0.0% | -- | |
| 09/18/2019 09/18/19 | Under Contract | -- | -- | -- | |
| 09/07/2019 09/07/19 | Price Changed | $1,225 | -2.0% | $1 / Sq Ft | |
| 09/03/2019 09/03/19 | Price Changed | $1,250 | -2.0% | $1 / Sq Ft | |
| 08/31/2019 08/31/19 | Price Changed | $1,275 | -1.5% | $1 / Sq Ft | |
| 08/24/2019 08/24/19 | Price Changed | $1,295 | -0.4% | $1 / Sq Ft | |
| 08/16/2019 08/16/19 | Price Changed | $1,300 | -6.8% | $1 / Sq Ft | |
| 08/08/2019 08/08/19 | For Rent | $1,395 | +16.7% | -- | |
| 07/17/2017 07/17/17 | Rented | $1,195 | +0.4% | -- | |
| 05/18/2017 05/18/17 | Price Changed | $1,190 | -0.4% | $1 / Sq Ft | |
| 05/04/2017 05/04/17 | For Rent | $1,195 | 0.0% | -- | |
| 12/16/2016 12/16/16 | Rented | $1,195 | 0.0% | -- | |
| 12/07/2016 12/07/16 | Under Contract | -- | -- | -- | |
| 10/21/2016 10/21/16 | For Rent | $1,195 | 0.0% | -- | |
| 10/13/2016 10/13/16 | Sold | $85,000 | -5.6% | $64 / Sq Ft | View Prior Sale |
| 09/19/2016 09/19/16 | Pending | -- | -- | -- | |
| 08/30/2016 08/30/16 | For Sale | $90,000 | -- | $68 / Sq Ft |
Purchase History
| Date | Type | Sale Price | Title Company |
|---|---|---|---|
| Warranty Deed | $85,000 | -- |
Source: First Multiple Listing Service (FMLS)
MLS Number: 7642574
APN: 17-0796-0-065-0
Disclaimer: Certain information contained herein is derived from information provided by parties other than Homes.com. All information provided is deemed reliable, but is not guaranteed to be accurate and should be independently verified.
![]() Listings identified with the FMLS IDX logo come from FMLS and are held by brokerage firms other than the owner of this website. The listing brokerage is identified in any listing details. Information is deemed reliable but is not guaranteed. If you believe any FMLS listing contains material that infringes your copyrighted work please visit www.fmls.com/dmca to review our DMCA policy and learn how to submit a takedown request. © 2025 First Multiple Listing Service, Inc.
Listings identified with the FMLS IDX logo come from FMLS and are held by brokerage firms other than the owner of this website. The listing brokerage is identified in any listing details. Information is deemed reliable but is not guaranteed. If you believe any FMLS listing contains material that infringes your copyrighted work please visit www.fmls.com/dmca to review our DMCA policy and learn how to submit a takedown request. © 2025 First Multiple Listing Service, Inc.
- 2240 Runnymead Ridge SE
- 2471 Cedar Brook W
- 708 Hanover Ln SE
- 738 Brentwood Place SE
- 2497 Cedar Canyon Place SE
- 2638 Stoney Creek Rd SE
- 720 Smithstone Rd SE
- 830 Bonnie Glen Dr SE
- 1129 Roselawn Ln SE
- 2330 Trellis Ln SE
- 731 Smithstone Ct SE
- 2685 Meadowlawn Dr SE
- 2683 Meadowlawn Dr SE
- 651 Inglis Dr SE
- 936 Bobcat Ct SE
- 940 Bobcat Ct SE
- 2205 Surrey Ct SE
- 2187 Palmyra Dr SE
- 2017 Powers Ferry Trace SE Unit 2017
- 742 Brentwood Place SE
- 2642 Stoney Creek Rd SE
- 502 Ivy Green Ln SE
- 705 Powers Ferry Rd SE
- 1113 Powers Ferry Place SE
- 731 Smithstone Ct SE
- 731 Smithstone Court South E
- 1035 Willow Field Ln SE
- 558 Lullingstone Dr SE
- 879 Forest Ridge Dr SE
- 899 SE Powers Ferry Rd
- 720 Brookline Dr SE
- 2703 Delk Rd SE
- 488 Salem Woods Dr SE
- 3400 Winterset Pkwy SE
- 1035 Franklin Gateway SE
- 2850 Delk Rd SE
