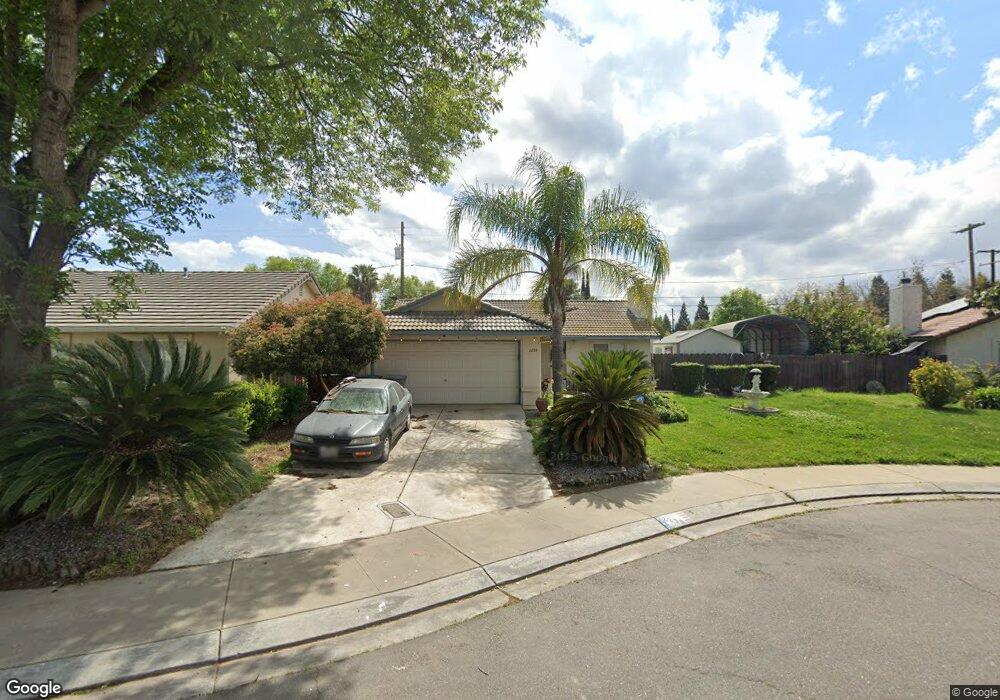
2238 Yorktown Square Merced, CA 95341
Southeast Merced NeighborhoodEstimated Value: $180,000 - $349,000
3
Beds
1
Bath
1,012
Sq Ft
$264/Sq Ft
Est. Value
About This Home
This home is located at 2238 Yorktown Square, Merced, CA 95341 and is currently estimated at $267,166, approximately $263 per square foot. 2238 Yorktown Square is a home located in Merced County with nearby schools including Pioneer Elementary School, Weaver Middle School, and Golden Valley High School.
Ownership History
Date
Name
Owned For
Owner Type
Purchase Details
Closed on
Oct 27, 2022
Sold by
Sanchotena John P
Bought by
Sanchotena John P and Sanchotena Maribel
Current Estimated Value
Purchase Details
Closed on
Feb 21, 2003
Sold by
Sanchotena John P
Bought by
Sanchotena John P
Home Financials for this Owner
Home Financials are based on the most recent Mortgage that was taken out on this home.
Original Mortgage
$108,950
Interest Rate
5.85%
Purchase Details
Closed on
Feb 18, 2000
Sold by
Hud
Bought by
Sanchotena John P
Home Financials for this Owner
Home Financials are based on the most recent Mortgage that was taken out on this home.
Original Mortgage
$65,460
Interest Rate
8.16%
Mortgage Type
FHA
Purchase Details
Closed on
Nov 3, 1999
Sold by
Norwest Mtg Inc
Bought by
Hud
Purchase Details
Closed on
Jul 9, 1999
Sold by
Samaniego Fredrick and Samaniego Lorenza
Bought by
Norwest Mtg Inc
Create a Home Valuation Report for This Property
The Home Valuation Report is an in-depth analysis detailing your home's value as well as a comparison with similar homes in the area
Home Values in the Area
Average Home Value in this Area
Purchase History
| Date | Buyer | Sale Price | Title Company |
|---|---|---|---|
| Sanchotena John P | -- | -- | |
| Sanchotena John P | -- | Chicago Title Company | |
| Sanchotena John P | $66,000 | North American Title Co | |
| Hud | -- | Fidelity National Title Ins | |
| Norwest Mtg Inc | $78,810 | Fidelity National Title Ins |
Source: Public Records
Mortgage History
| Date | Status | Borrower | Loan Amount |
|---|---|---|---|
| Previous Owner | Sanchotena John P | $108,950 | |
| Previous Owner | Sanchotena John P | $65,460 |
Source: Public Records
Tax History Compared to Growth
Tax History
| Year | Tax Paid | Tax Assessment Tax Assessment Total Assessment is a certain percentage of the fair market value that is determined by local assessors to be the total taxable value of land and additions on the property. | Land | Improvement |
|---|---|---|---|---|
| 2025 | $1,055 | $101,421 | $38,415 | $63,006 |
| 2024 | $1,055 | $99,433 | $37,662 | $61,771 |
| 2023 | $1,029 | $97,484 | $36,924 | $60,560 |
| 2022 | $1,021 | $95,573 | $36,200 | $59,373 |
| 2021 | $1,021 | $93,700 | $35,491 | $58,209 |
| 2020 | $1,009 | $92,741 | $35,128 | $57,613 |
| 2019 | $989 | $90,924 | $34,440 | $56,484 |
| 2018 | $957 | $89,142 | $33,765 | $55,377 |
| 2017 | $1,773 | $87,395 | $33,103 | $54,292 |
| 2016 | $1,773 | $85,682 | $32,454 | $53,228 |
| 2015 | $1,719 | $84,396 | $31,967 | $52,429 |
| 2014 | $1,696 | $82,743 | $31,341 | $51,402 |
Source: Public Records
Map
Nearby Homes
- 2344 Siena Ct
- 194 Livorno Ct
- 2415 E Childs Ave
- 2499 E Gerard Ave Unit 50
- 2499 E Gerard Ave Unit 96
- 2499 E Gerard Ave Unit 185
- 2540 E Childs Ave
- 1800 E Childs Ave
- 2967 Capella Dr
- 602 Laughlin Ln
- 0 Henry St
- 1/2 Henry St
- 0 1/2 Henry St
- 1283 Weaver Ave
- 2240 Golden Oak Ln Unit 80
- 2240 Golden Oak Ln Unit 94
- 2240 Golden Oak Ln Unit 103
- 2240 Golden Oak Ln Unit 108
- 2240 Yorktown Square
- 2219 Emerson Ave
- 2236 Yorktown Square
- 2227 Emerson Ave
- 2252 Yorktown Square
- 2211 Emerson Ave
- 207 Yorktown Square
- 2235 Emerson Ave
- 2241 Yorktown Square
- 2228 Birchwood Ct
- 2262 Yorktown Square
- 205 Yorktown Square
- 2225 Birchwood Ct
- 2253 Yorktown Square
- 303 Donner Rd
- 2243 Emerson Ave
- 203 Yorktown Square
- 2274 Yorktown Square
- 2261 Yorktown Square
- 2224 Birchwood Ct