2239 Gloaming Way Beverly Hills, CA 90210
Beverly Crest NeighborhoodEstimated Value: $1,799,000 - $2,355,000
2
Beds
2
Baths
1,665
Sq Ft
$1,205/Sq Ft
Est. Value
About This Home
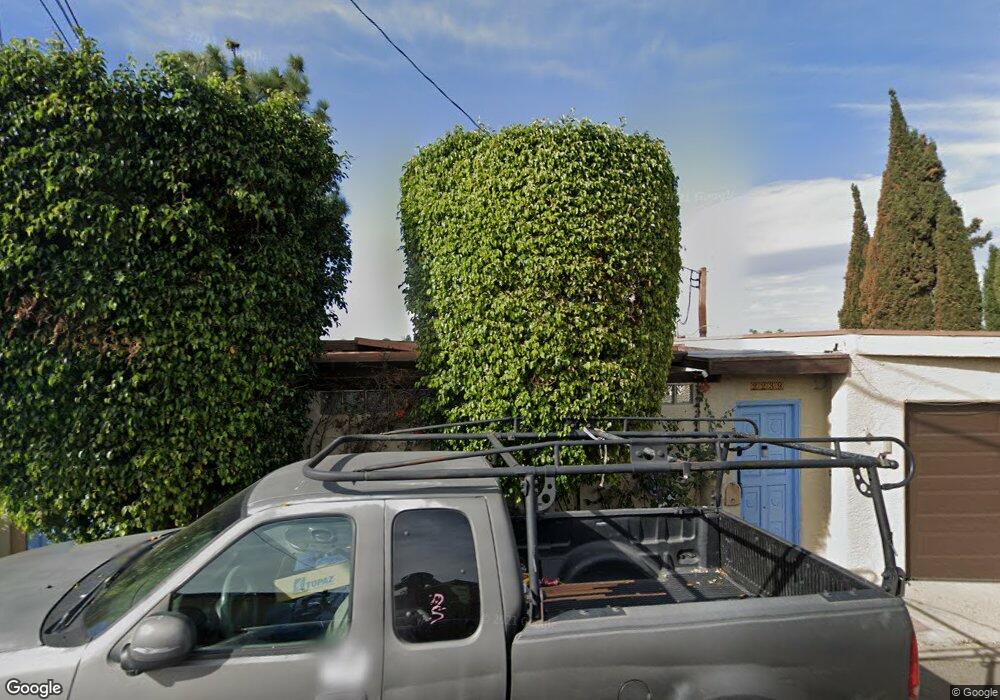
This home is located at 2239 Gloaming Way, Beverly Hills, CA 90210 and is currently estimated at $2,005,690, approximately $1,204 per square foot. 2239 Gloaming Way is a home located in Los Angeles County with nearby schools including West Hollywood Elementary School, Tree Academy (Academy for the Creative Arts, New Technology and Social Justice), and Harvard-Westlake School.
Ownership History
Date
Name
Owned For
Owner Type
Purchase Details
Closed on
May 18, 2005
Sold by
Braun Jonathon
Bought by
Braun Jonathon and The Jonathon Braun Family Trus
Current Estimated Value
Purchase Details
Closed on
Jul 2, 2003
Sold by
Strauss David and Strauss Jo Ellen
Bought by
Braun Jonathon
Home Financials for this Owner
Home Financials are based on the most recent Mortgage that was taken out on this home.
Original Mortgage
$544,000
Outstanding Balance
$224,478
Interest Rate
4.87%
Mortgage Type
Purchase Money Mortgage
Estimated Equity
$1,781,212
Purchase Details
Closed on
Jul 24, 1995
Sold by
Strauss David and Strauss Jo Ellen
Bought by
Strauss David and Strauss Jo Ellen
Home Financials for this Owner
Home Financials are based on the most recent Mortgage that was taken out on this home.
Original Mortgage
$203,150
Interest Rate
7.61%
Create a Home Valuation Report for This Property
The Home Valuation Report is an in-depth analysis detailing your home's value as well as a comparison with similar homes in the area
Home Values in the Area
Average Home Value in this Area
Purchase History
| Date | Buyer | Sale Price | Title Company |
|---|---|---|---|
| Braun Jonathon | -- | -- | |
| Braun Jonathon | -- | -- | |
| Braun Jonathon | -- | Equity Title Company | |
| Strauss David | -- | Commonwealth Land Title Co |
Source: Public Records
Mortgage History
| Date | Status | Borrower | Loan Amount |
|---|---|---|---|
| Open | Braun Jonathon | $544,000 | |
| Previous Owner | Strauss David | $203,150 |
Source: Public Records
Tax History Compared to Growth
Tax History
| Year | Tax Paid | Tax Assessment Tax Assessment Total Assessment is a certain percentage of the fair market value that is determined by local assessors to be the total taxable value of land and additions on the property. | Land | Improvement |
|---|---|---|---|---|
| 2025 | $11,728 | $966,798 | $773,446 | $193,352 |
| 2024 | $11,728 | $947,842 | $758,281 | $189,561 |
| 2023 | $11,506 | $929,258 | $743,413 | $185,845 |
| 2022 | $11,004 | $911,038 | $728,837 | $182,201 |
| 2021 | $10,867 | $893,176 | $714,547 | $178,629 |
| 2019 | $10,477 | $866,686 | $693,354 | $173,332 |
| 2018 | $10,398 | $849,693 | $679,759 | $169,934 |
| 2016 | $9,909 | $816,700 | $653,364 | $163,336 |
| 2015 | $9,764 | $804,433 | $643,550 | $160,883 |
| 2014 | $9,801 | $788,676 | $630,944 | $157,732 |
Source: Public Records
Map
Nearby Homes
- 2235 Gloaming Way
- 2241 Betty Ln
- 2250 Betty Ln
- 2341 Gloaming Way
- 2268 Betty Ln
- 9415 Cherokee Ln
- 2207 Bowmont Dr
- 2241 Bowmont Dr
- 2064 Coldwater Canyon Dr
- 2320 Bowmont Dr
- 9580 Shirley Ln
- 9338 1/2 Hazen Dr
- 565 Evelyn Place
- 9495 Gloaming Dr
- 9301 Cherokee Ln
- 570 Evelyn Place
- 2430 Coldwater Canyon Dr
- 2401 Bowmont Dr
- 2002 Loma Vista Dr
- 2450 Coldwater Canyon Dr
- 2251 Gloaming Way
- 2231 Gloaming Way
- 2250 Gloaming Way
- 2229 Gloaming Way
- 9550 Sherwood Forest Ln
- 9560 Sherwood Forest Ln
- 9556 Sherwood Forest Ln
- 9524 Dalegrove Dr
- 9551 Sherwood Forest Ln
- 9495 Rembert Ln
- 2259 Gloaming Way
- 2256 Gloaming Way
- 9496 Rembert Ln
- 2271 Gloaming Way
- 2250 Coldwater Canyon Dr
- 2242 Coldwater Canyon Dr
- 2256 Coldwater Canyon Dr
- 2258 Gloaming Way
- 2236 Coldwater Canyon Dr
- 9491 Rembert Ln