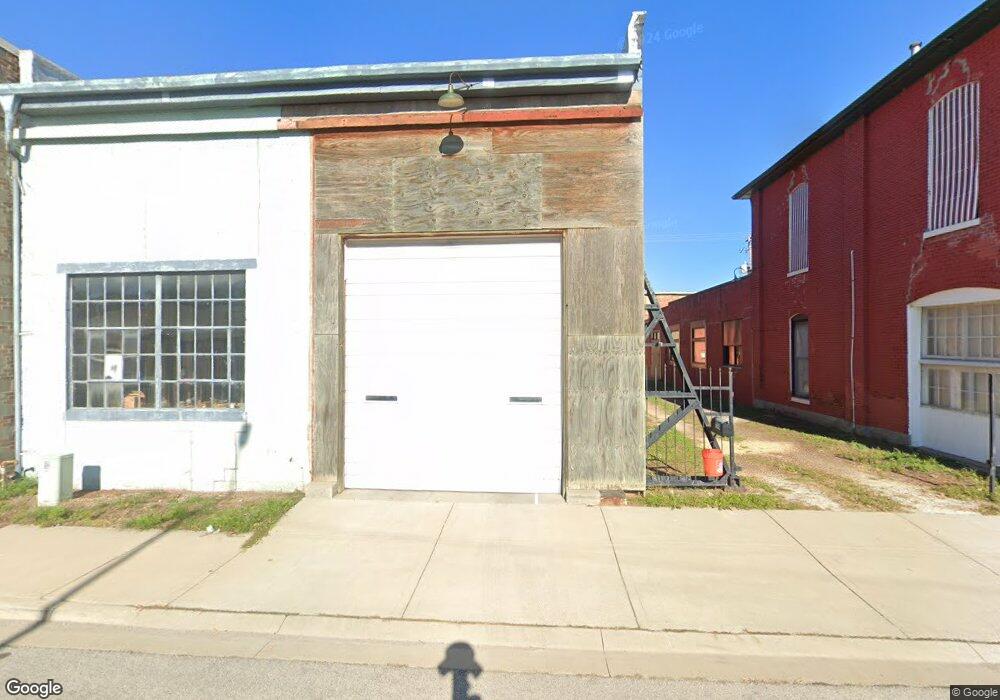
224 Choctaw St Leavenworth, KS 66048
Estimated Value: $175,169
--
Bed
2
Baths
4,195
Sq Ft
$42/Sq Ft
Est. Value
About This Home
This home is located at 224 Choctaw St, Leavenworth, KS 66048 and is currently estimated at $175,169, approximately $41 per square foot. 224 Choctaw St is a home located in Leavenworth County with nearby schools including Richard Warren Middle School and Leavenworth Senior High School.
Ownership History
Date
Name
Owned For
Owner Type
Purchase Details
Closed on
May 4, 2023
Sold by
Trisha P Homes Llc
Bought by
Walker Kjell
Current Estimated Value
Purchase Details
Closed on
Nov 16, 2022
Sold by
Powell Property Solutions Llc
Bought by
Trisha P Homes Llc
Purchase Details
Closed on
Aug 24, 2021
Sold by
Mugwamps Llc
Bought by
Laven Lance T and Laven Jenny A
Home Financials for this Owner
Home Financials are based on the most recent Mortgage that was taken out on this home.
Original Mortgage
$80,000
Interest Rate
2.8%
Mortgage Type
New Conventional
Purchase Details
Closed on
Jun 27, 2016
Sold by
Wendt Kevin A
Bought by
Mugwamps Llc
Home Financials for this Owner
Home Financials are based on the most recent Mortgage that was taken out on this home.
Original Mortgage
$96,000
Interest Rate
3.57%
Mortgage Type
New Conventional
Create a Home Valuation Report for This Property
The Home Valuation Report is an in-depth analysis detailing your home's value as well as a comparison with similar homes in the area
Home Values in the Area
Average Home Value in this Area
Purchase History
| Date | Buyer | Sale Price | Title Company |
|---|---|---|---|
| Walker Kjell | -- | Alliance Title | |
| Trisha P Homes Llc | -- | -- | |
| Laven Lance T | -- | Lawyers Title | |
| Mugwamps Llc | $120,000 | Kansas Secured Title |
Source: Public Records
Mortgage History
| Date | Status | Borrower | Loan Amount |
|---|---|---|---|
| Previous Owner | Laven Lance T | $80,000 | |
| Previous Owner | Mugwamps Llc | $96,000 |
Source: Public Records
Tax History Compared to Growth
Tax History
| Year | Tax Paid | Tax Assessment Tax Assessment Total Assessment is a certain percentage of the fair market value that is determined by local assessors to be the total taxable value of land and additions on the property. | Land | Improvement |
|---|---|---|---|---|
| 2025 | $5,363 | $42,251 | $6,653 | $35,598 |
| 2024 | $4,083 | $40,281 | $6,013 | $34,268 |
| 2023 | $4,083 | $29,633 | $6,013 | $23,620 |
| 2022 | $3,667 | $26,053 | $6,013 | $20,040 |
| 2021 | $2,567 | $16,218 | $2,843 | $13,375 |
| 2020 | $2,675 | $16,951 | $2,843 | $14,108 |
| 2019 | $2,694 | $16,951 | $2,843 | $14,108 |
| 2018 | $2,711 | $16,951 | $2,843 | $14,108 |
| 2017 | $2,204 | $16,501 | $2,843 | $13,658 |
| 2016 | $1,910 | $14,276 | $2,843 | $11,433 |
| 2015 | $1,898 | $14,275 | $2,985 | $11,290 |
| 2014 | $1,890 | $14,275 | $3,125 | $11,150 |
Source: Public Records
Map
Nearby Homes
- 100 N Esplanade St
- 605 Oak St
- 309 N Esplanade St
- 313 N Esplanade St
- 600 Shawnee St
- 409 N Esplanade St
- 321 Pottawatomie St
- 611 Miami St
- 514 W 7th St
- 314 N 6th St
- 520 Spruce St
- 426 Pottawatomie St
- 928 S Esplanade St
- 611 Olive St
- 624 Spruce St
- 725 Chestnut St
- 915 4th Ave
- 322 Arch St
- 319 Arch St
- 715 Ottawa St
- 206 Choctaw St
- 301 Cherokee St
- 305 Cherokee St
- 410 S 2nd St
- 311 Cherokee St
- 223 Delaware St
- 401 S 2nd St
- 401 S 2nd St
- 325 Delaware St
- 117 Delaware St
- 410 S 4th St
- 314 Delaware St
- 331 Delaware St
- 314 Delaware St
- 316 Delaware St
- 413 Cherokee St
- 322 Delaware St
- 405 Choctaw St
- 330 Delaware St
- 400 Delaware St