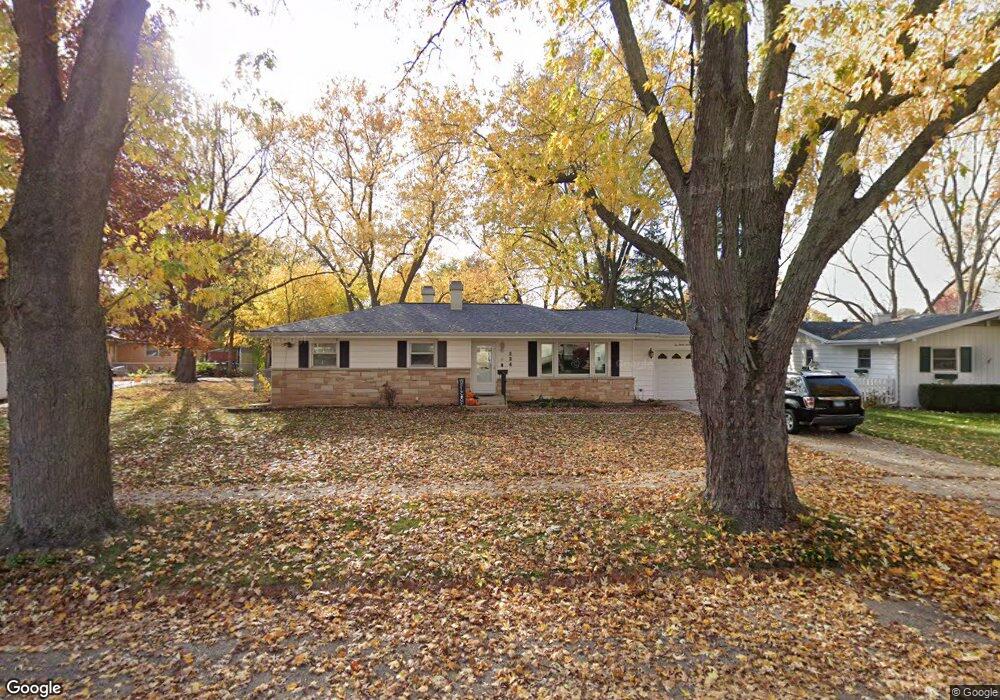
224 Pauline Dr Elgin, IL 60123
North Country Knolls NeighborhoodEstimated Value: $248,000 - $299,000
3
Beds
1
Bath
1,152
Sq Ft
$244/Sq Ft
Est. Value
About This Home
This home is located at 224 Pauline Dr, Elgin, IL 60123 and is currently estimated at $281,367, approximately $244 per square foot. 224 Pauline Dr is a home located in Kane County with nearby schools including Hillcrest Elementary School, Abbott Middle School, and Larkin High School.
Ownership History
Date
Name
Owned For
Owner Type
Purchase Details
Closed on
Jan 15, 2021
Sold by
Coulombe Kimberlee and Coulombe Daniel J
Bought by
Torres David and Torres Rachel
Current Estimated Value
Home Financials for this Owner
Home Financials are based on the most recent Mortgage that was taken out on this home.
Original Mortgage
$174,600
Outstanding Balance
$153,040
Interest Rate
2.5%
Mortgage Type
New Conventional
Estimated Equity
$128,327
Purchase Details
Closed on
Jan 13, 2021
Sold by
Coulombe Kimberlee and Coulombe Daniel J
Bought by
Torres David and Torres Rachel
Home Financials for this Owner
Home Financials are based on the most recent Mortgage that was taken out on this home.
Original Mortgage
$174,600
Outstanding Balance
$153,040
Interest Rate
2.5%
Mortgage Type
New Conventional
Estimated Equity
$128,327
Purchase Details
Closed on
Mar 22, 2019
Sold by
Coulombe Kim and Coulombe Kimberlee
Bought by
Coulombe Kimberlee and Coulombe Daniel J
Purchase Details
Closed on
Dec 12, 2014
Sold by
Frazier Dianna
Bought by
Coulombe Kim and Sisti James M
Purchase Details
Closed on
Jun 26, 2012
Sold by
Frazier Dianna
Bought by
Frazier Dianna and Coulombe Kim
Purchase Details
Closed on
Nov 10, 1994
Sold by
Sisti James A and Sisti Rita
Bought by
Sisti James A and Sisti Rita
Create a Home Valuation Report for This Property
The Home Valuation Report is an in-depth analysis detailing your home's value as well as a comparison with similar homes in the area
Home Values in the Area
Average Home Value in this Area
Purchase History
| Date | Buyer | Sale Price | Title Company |
|---|---|---|---|
| Torres David | $180,000 | None Listed On Document | |
| Torres David | $180,000 | Ct | |
| Coulombe Kimberlee | -- | Chicago Title | |
| Coulombe Kimberlee | $88,500 | Chicago Title | |
| Coulombe Kim | -- | None Available | |
| Frazier Dianna | -- | None Available | |
| Sisti James A | -- | -- |
Source: Public Records
Mortgage History
| Date | Status | Borrower | Loan Amount |
|---|---|---|---|
| Open | Torres David | $174,600 | |
| Closed | Torres David | $174,600 |
Source: Public Records
Tax History
| Year | Tax Paid | Tax Assessment Tax Assessment Total Assessment is a certain percentage of the fair market value that is determined by local assessors to be the total taxable value of land and additions on the property. | Land | Improvement |
|---|---|---|---|---|
| 2024 | $5,412 | $75,627 | $25,563 | $50,064 |
| 2023 | $5,142 | $68,323 | $23,094 | $45,229 |
| 2022 | $4,882 | $62,299 | $21,058 | $41,241 |
| 2021 | $5,196 | $58,245 | $19,688 | $38,557 |
| 2020 | $5,071 | $55,604 | $18,795 | $36,809 |
| 2019 | $4,947 | $52,966 | $17,903 | $35,063 |
| 2018 | $4,781 | $48,354 | $16,866 | $31,488 |
| 2017 | $4,702 | $45,711 | $15,944 | $29,767 |
| 2016 | $4,523 | $42,408 | $14,792 | $27,616 |
| 2015 | -- | $38,871 | $13,558 | $25,313 |
| 2014 | -- | $38,391 | $13,391 | $25,000 |
| 2013 | -- | $39,403 | $13,744 | $25,659 |
Source: Public Records
Map
Nearby Homes
- 10N836 Maple St
- 1455 Erie St
- 1849 Larkin Ave
- 262 S Weston Ave
- 70 S Weston Ave
- 10N827 Hawthorne St
- 136 Mckinstry Dr
- 221 Heine Ave
- 1780 Pebble Beach Cir
- 1059 Larkin Ave
- 2205 Country Knoll Ln
- 1633 Pebble Beach Cir Unit 6
- 1670 College Green Dr Unit 2
- 400 Marguerite St
- 1780 College Green Dr Unit 7
- 1661 College Green Dr
- 1840 W Highland Ave Unit E-105
- 2060 Muirfield Cir
- 40 Acres Randall Rd
- 835 Oak St
- 216 Pauline Dr
- 1665 Meyer Ct
- 232 Pauline Dr
- 1663 Meyer Ct
- 208 Pauline Dr Unit 5
- 215 Pauline Dr
- 230 S Lyle Ave
- 224 S Lyle Ave
- 225 Pauline Dr
- 205 Pauline Dr
- 218 S Lyle Ave
- 234 S Lyle Ave
- 200 Pauline Dr
- 210 S Lyle Ave
- 1661 Meyer Ct
- 1660 Meyer St
- 238 S Lyle Ave
- 195 Pauline Dr Unit 5
- 208 S Lyle Ave
- 1651 Meyer Ct
Your Personal Tour Guide
Ask me questions while you tour the home.