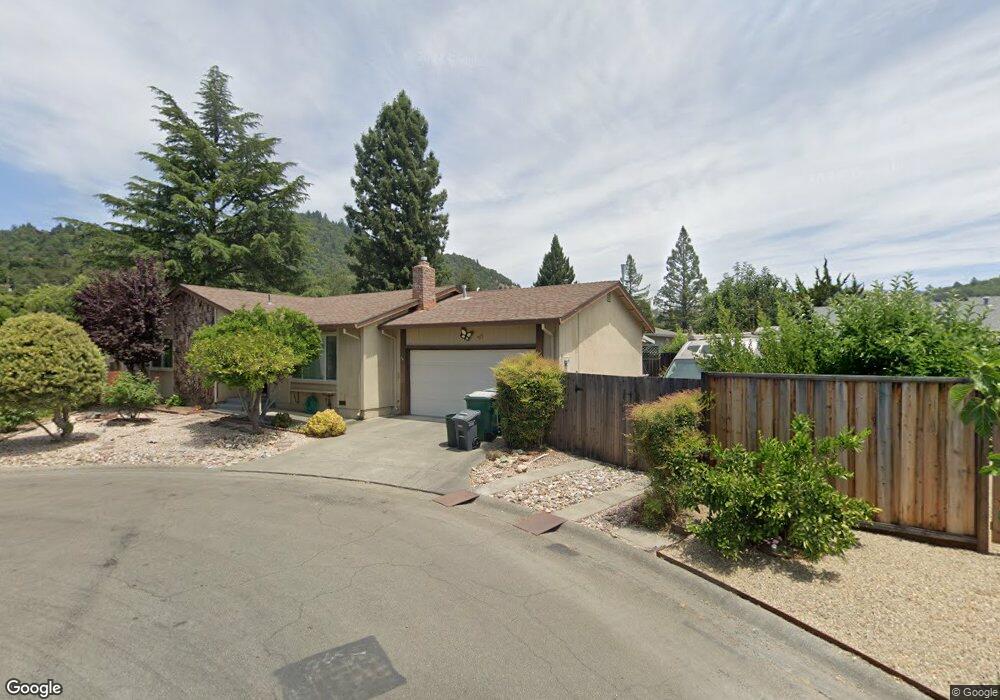
224 Sequoia Cir Healdsburg, CA 95448
Estimated Value: $630,000 - $800,000
2
Beds
2
Baths
1,200
Sq Ft
$593/Sq Ft
Est. Value
About This Home
This home is located at 224 Sequoia Cir, Healdsburg, CA 95448 and is currently estimated at $711,090, approximately $592 per square foot. 224 Sequoia Cir is a home located in Sonoma County with nearby schools including Healdsburg Elementary School, Healdsburg Junior High School, and Healdsburg High School.
Ownership History
Date
Name
Owned For
Owner Type
Purchase Details
Closed on
Sep 8, 2016
Sold by
Weed Robert H and Weed Carol A
Bought by
Felder Mike and The Mike Felder Revocable Trus
Current Estimated Value
Home Financials for this Owner
Home Financials are based on the most recent Mortgage that was taken out on this home.
Original Mortgage
$372,000
Outstanding Balance
$297,616
Interest Rate
3.48%
Mortgage Type
New Conventional
Estimated Equity
$413,474
Purchase Details
Closed on
Jun 6, 2016
Sold by
Weed Robert H
Bought by
Weed Robert H and Robert H Weed & Carol A Weed 2
Purchase Details
Closed on
Dec 23, 2015
Sold by
Weed Robert Harvey and Weed Mortimer
Bought by
Weed Robert H and Frances V Weed Irrevocable Tru
Purchase Details
Closed on
May 3, 2002
Sold by
Weed Mortimer H and Weed Frances V
Bought by
Weed Mortimer H and Weed Frances V
Create a Home Valuation Report for This Property
The Home Valuation Report is an in-depth analysis detailing your home's value as well as a comparison with similar homes in the area
Home Values in the Area
Average Home Value in this Area
Purchase History
| Date | Buyer | Sale Price | Title Company |
|---|---|---|---|
| Felder Mike | $465,000 | Fidelity National Title Co | |
| Weed Robert H | -- | None Available | |
| Weed Robert H | -- | None Available | |
| Weed Robert H | -- | None Available | |
| Weed Mortimer H | -- | -- | |
| Weed Mortimer H | -- | -- |
Source: Public Records
Mortgage History
| Date | Status | Borrower | Loan Amount |
|---|---|---|---|
| Open | Felder Mike | $372,000 |
Source: Public Records
Tax History
| Year | Tax Paid | Tax Assessment Tax Assessment Total Assessment is a certain percentage of the fair market value that is determined by local assessors to be the total taxable value of land and additions on the property. | Land | Improvement |
|---|---|---|---|---|
| 2025 | $6,151 | $539,665 | $215,865 | $323,800 |
| 2024 | $6,151 | $529,084 | $211,633 | $317,451 |
| 2023 | $6,151 | $518,711 | $207,484 | $311,227 |
| 2022 | $5,984 | $508,541 | $203,416 | $305,125 |
| 2021 | $5,927 | $498,571 | $199,428 | $299,143 |
| 2020 | $5,867 | $493,460 | $197,384 | $296,076 |
| 2019 | $5,744 | $483,785 | $193,514 | $290,271 |
| 2018 | $5,632 | $474,300 | $189,720 | $284,580 |
| 2017 | $5,496 | $465,000 | $186,000 | $279,000 |
| 2016 | $791 | $62,107 | $12,414 | $49,693 |
| 2015 | $777 | $61,175 | $12,228 | $48,947 |
| 2014 | $773 | $59,978 | $11,989 | $47,989 |
Source: Public Records
Map
Nearby Homes
- 1421 Oak Cir
- 330 Orchard St
- 1561 S Fitch Mountain Rd
- 843 Falcon Way
- 199 Bailhache Ave
- 1625 Madrone Ave
- 401 Fairway Ct
- 936 Valley View Dr
- 446 Tee Ct
- 101 Bailhache Ave
- 1026 Sunset Dr
- 421 Tee Dr
- 433 Tee Ct
- 541 Mason St Unit 8
- 775 Florence Ln
- 2016 Riverview Dr
- 31 Front St Unit E
- 423 Matheson St
- 431 University St
- 716 University St
- 221 Cottonwood Cir
- 229 Sequoia Cir
- 218 Sequoia Cir
- 217 Cottonwood Cir
- 229 Cottonwood Cir
- 214 Sequoia Cir
- 213 Cottonwood Cir
- 220 Orangewood Dr
- 224 Cottonwood Cir
- 232 Orangewood Dr
- 216 Orangewood Dr
- 218 Cottonwood Cir
- 210 Sequoia Cir
- 209 Cottonwood Cir
- 305 Cypress Cir
- 214 Cottonwood Cir
- 212 Orangewood Dr
- 305 Olive Cir
- 309 Olive Cir
- 302 Orangewood Dr
Your Personal Tour Guide
Ask me questions while you tour the home.