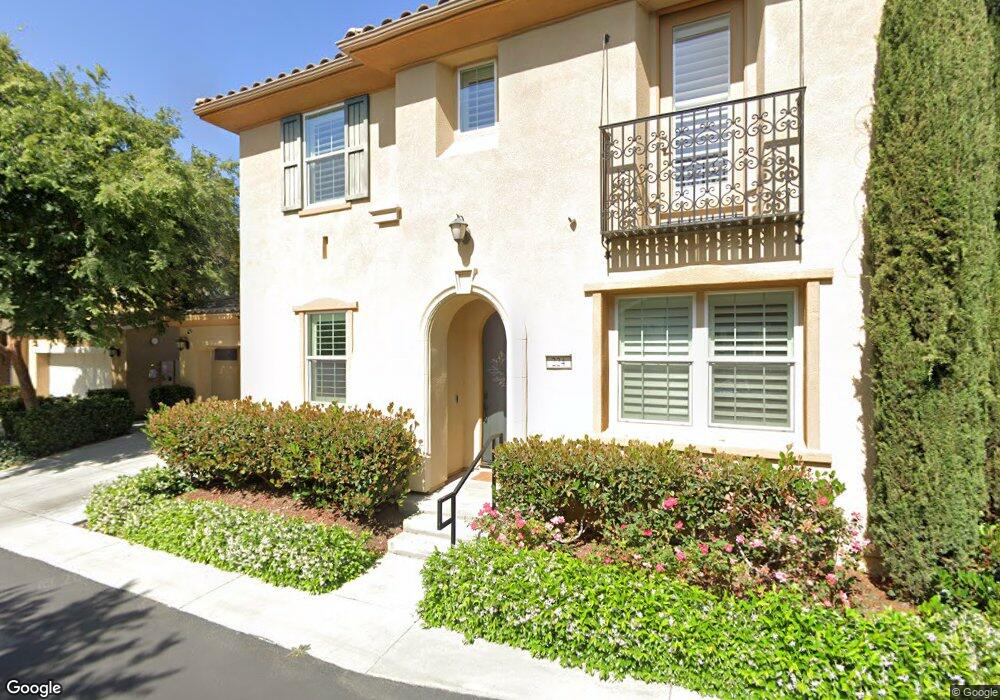
224 Wicker Unit 66 Irvine, CA 92618
Great Park NeighborhoodEstimated Value: $1,770,825 - $1,961,000
4
Beds
3
Baths
2,568
Sq Ft
$728/Sq Ft
Est. Value
About This Home
This home is located at 224 Wicker Unit 66, Irvine, CA 92618 and is currently estimated at $1,868,956, approximately $727 per square foot. 224 Wicker Unit 66 is a home located in Orange County with nearby schools including Beacon Park, Portola High School, and Woodbury Elementary School.
Ownership History
Date
Name
Owned For
Owner Type
Purchase Details
Closed on
Aug 25, 2021
Sold by
K & H Living Trust and Washkuhn Heather
Bought by
Steshenko Alexander
Current Estimated Value
Home Financials for this Owner
Home Financials are based on the most recent Mortgage that was taken out on this home.
Original Mortgage
$1,068,750
Outstanding Balance
$973,347
Interest Rate
2.86%
Estimated Equity
$895,609
Purchase Details
Closed on
Aug 16, 2021
Sold by
Steshenko Liudmila
Bought by
Steshenko Alexander
Home Financials for this Owner
Home Financials are based on the most recent Mortgage that was taken out on this home.
Original Mortgage
$1,068,750
Outstanding Balance
$973,347
Interest Rate
2.86%
Estimated Equity
$895,609
Purchase Details
Closed on
Jul 14, 2014
Sold by
Lennar Homes Of California Inc
Bought by
Badii Kirk and Washkuhn Heather
Home Financials for this Owner
Home Financials are based on the most recent Mortgage that was taken out on this home.
Original Mortgage
$625,500
Interest Rate
3.62%
Mortgage Type
Adjustable Rate Mortgage/ARM
Create a Home Valuation Report for This Property
The Home Valuation Report is an in-depth analysis detailing your home's value as well as a comparison with similar homes in the area
Home Values in the Area
Average Home Value in this Area
Purchase History
| Date | Buyer | Sale Price | Title Company |
|---|---|---|---|
| Steshenko Alexander | $1,459,000 | None Listed On Document | |
| Steshenko Alexander | -- | New Title Company Name | |
| Badii Kirk | $942,000 | North American Title |
Source: Public Records
Mortgage History
| Date | Status | Borrower | Loan Amount |
|---|---|---|---|
| Open | Steshenko Alexander | $1,068,750 | |
| Closed | Steshenko Alexander | $1,068,750 | |
| Previous Owner | Badii Kirk | $625,500 |
Source: Public Records
Tax History
| Year | Tax Paid | Tax Assessment Tax Assessment Total Assessment is a certain percentage of the fair market value that is determined by local assessors to be the total taxable value of land and additions on the property. | Land | Improvement |
|---|---|---|---|---|
| 2025 | $23,102 | $1,548,301 | $975,679 | $572,622 |
| 2024 | $23,102 | $1,517,943 | $956,548 | $561,395 |
| 2023 | $22,596 | $1,488,180 | $937,792 | $550,388 |
| 2022 | $22,152 | $1,459,000 | $919,403 | $539,597 |
| 2021 | $17,675 | $1,045,911 | $517,898 | $528,013 |
| 2020 | $17,514 | $1,035,187 | $512,588 | $522,599 |
| 2019 | $17,224 | $1,014,890 | $502,538 | $512,352 |
| 2018 | $16,884 | $994,991 | $492,685 | $502,306 |
| 2017 | $16,552 | $975,482 | $483,025 | $492,457 |
| 2016 | $16,226 | $956,355 | $473,554 | $482,801 |
| 2015 | $16,022 | $941,990 | $466,441 | $475,549 |
Source: Public Records
Map
Nearby Homes
Your Personal Tour Guide
Ask me questions while you tour the home.