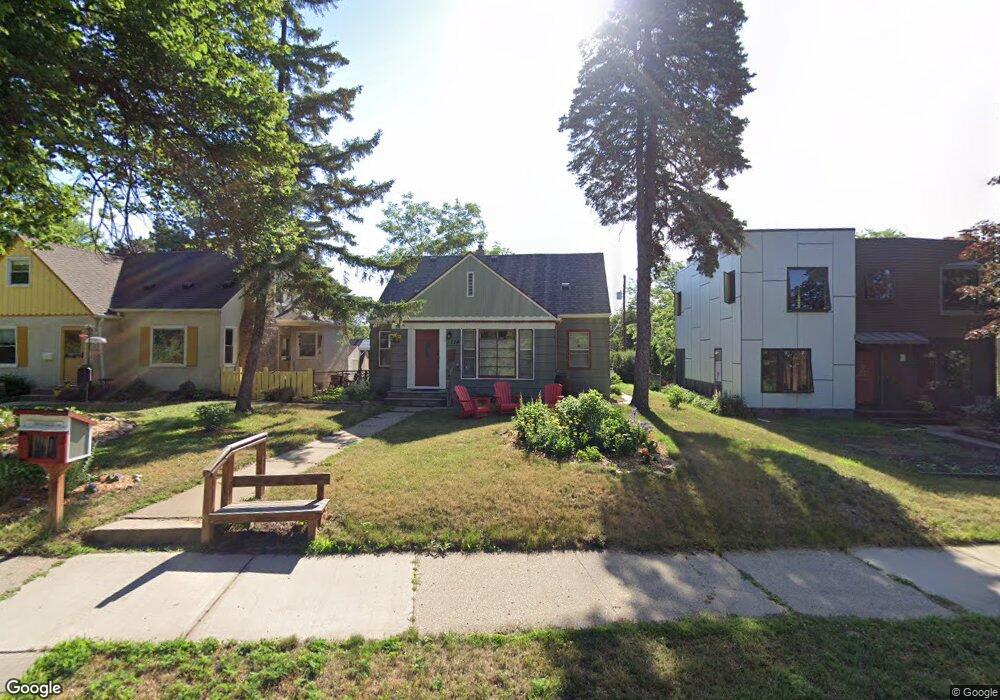
224 Xerxes Ave N Minneapolis, MN 55405
Bryn Mawr NeighborhoodEstimated Value: $480,000 - $508,349
3
Beds
2
Baths
2,399
Sq Ft
$205/Sq Ft
Est. Value
About This Home
This home is located at 224 Xerxes Ave N, Minneapolis, MN 55405 and is currently estimated at $491,337, approximately $204 per square foot. 224 Xerxes Ave N is a home located in Hennepin County with nearby schools including Bryn Mawr Elementary School, Anwatin Middle School, and North High School.
Ownership History
Date
Name
Owned For
Owner Type
Purchase Details
Closed on
Sep 25, 2020
Sold by
Anderson Emily L and Anderson Kyle Thomas
Bought by
Mccray Lucinda M
Current Estimated Value
Home Financials for this Owner
Home Financials are based on the most recent Mortgage that was taken out on this home.
Original Mortgage
$230,000
Outstanding Balance
$204,200
Interest Rate
2.8%
Mortgage Type
New Conventional
Estimated Equity
$287,137
Purchase Details
Closed on
Sep 24, 2020
Sold by
Anderson Emily L and Anderson Thomas W
Bought by
Anderson Emily L
Home Financials for this Owner
Home Financials are based on the most recent Mortgage that was taken out on this home.
Original Mortgage
$230,000
Outstanding Balance
$204,200
Interest Rate
2.8%
Mortgage Type
New Conventional
Estimated Equity
$287,137
Purchase Details
Closed on
May 8, 1997
Sold by
Kager Kelly M
Bought by
Kyle Thomas W and Anderson Emily E
Create a Home Valuation Report for This Property
The Home Valuation Report is an in-depth analysis detailing your home's value as well as a comparison with similar homes in the area
Home Values in the Area
Average Home Value in this Area
Purchase History
| Date | Buyer | Sale Price | Title Company |
|---|---|---|---|
| Mccray Lucinda M | $362,500 | Edina Realty Title Inc | |
| Anderson Emily L | $500 | None Listed On Document | |
| Kyle Thomas W | $110,000 | -- | |
| Mccray Lucinda Lucinda | $362,500 | -- |
Source: Public Records
Mortgage History
| Date | Status | Borrower | Loan Amount |
|---|---|---|---|
| Open | Mccray Lucinda M | $230,000 | |
| Closed | Mccray Lucinda Lucinda | $230,000 |
Source: Public Records
Tax History Compared to Growth
Tax History
| Year | Tax Paid | Tax Assessment Tax Assessment Total Assessment is a certain percentage of the fair market value that is determined by local assessors to be the total taxable value of land and additions on the property. | Land | Improvement |
|---|---|---|---|---|
| 2024 | $6,725 | $459,000 | $248,000 | $211,000 |
| 2023 | $6,071 | $467,000 | $248,000 | $219,000 |
| 2022 | $4,148 | $422,000 | $202,000 | $220,000 |
| 2021 | $3,911 | $309,000 | $152,000 | $157,000 |
| 2020 | $4,311 | $302,500 | $96,800 | $205,700 |
| 2019 | $4,442 | $296,500 | $96,800 | $199,700 |
| 2018 | $4,072 | $296,500 | $96,800 | $199,700 |
| 2017 | $3,928 | $257,000 | $88,000 | $169,000 |
| 2016 | $3,636 | $243,500 | $88,000 | $155,500 |
| 2015 | $3,572 | $218,000 | $88,000 | $130,000 |
| 2014 | -- | $232,500 | $88,000 | $144,500 |
Source: Public Records
Map
Nearby Homes
- 20 Vincent Ave S
- 32 Sheridan Ave S
- 37 Queen Ave S
- 20 Penn Ave S
- 40 Penn Ave S
- 712 Cedar Lake Rd S
- 2224 4th Ave N
- 4004 Roanoke Cir
- 2432 Mount View Ave
- 210 Sunnyridge Cir
- 2423 Mount View Ave
- 2108 Glenwood Ave
- 212 Cedar Lake Rd S
- 1017 Thomas Ave S
- 723 Sheridan Ave N
- 1049 Thomas Ave S
- 1136 Xerxes Ave S
- 819 Sheridan Ave N
- 1125 Tyrol Trail
- 723 Penn Ave N
- 220 Xerxes Ave N
- 228 Xerxes Ave N
- 232 Xerxes Ave N
- 216 Xerxes Ave N
- 221 Washburn Ave N
- 225 Washburn Ave N
- 236 Xerxes Ave N
- 217 Washburn Ave N
- 233 Washburn Ave N
- 213 Washburn Ave N
- 240 Xerxes Ave N
- 237 Washburn Ave N
- 2X Washburn Ave S
- 2919 Chestnut Ave
- 244 Xerxes Ave N
- 4 Washburn Ave S
- 13 Xerxes Ave S
- 245 Washburn Ave N
- 2X 2x Washburn Ave S
- 248 Xerxes Ave N