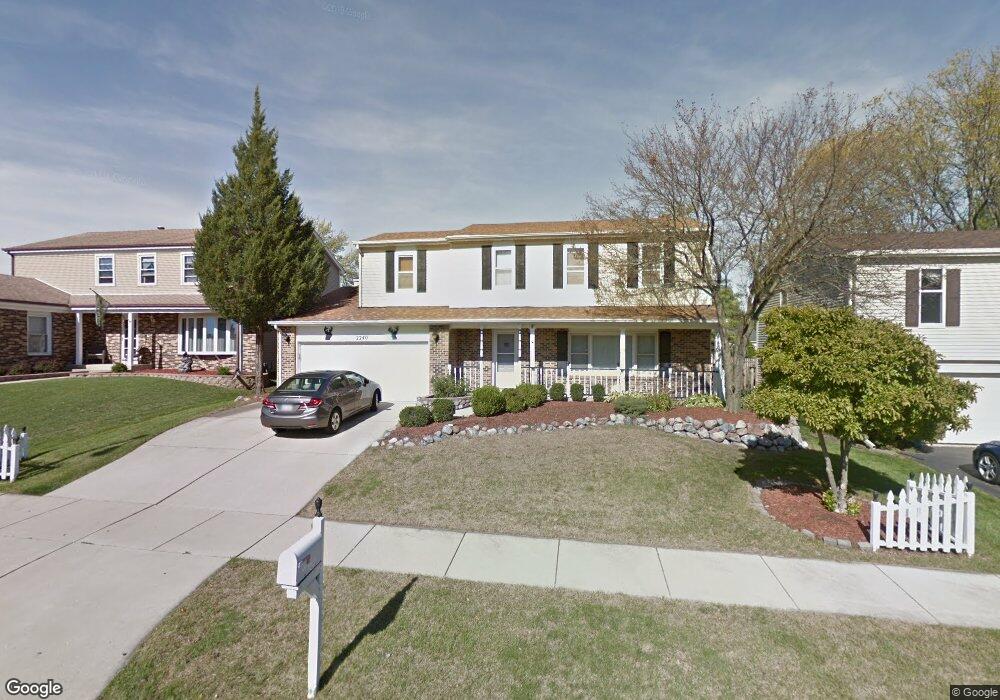
2240 Ridge Ave Unit 9 Aurora, IL 60504
South East Village NeighborhoodEstimated Value: $295,000 - $449,000
4
Beds
3
Baths
2,516
Sq Ft
$154/Sq Ft
Est. Value
About This Home
This home is located at 2240 Ridge Ave Unit 9, Aurora, IL 60504 and is currently estimated at $386,536, approximately $153 per square foot. 2240 Ridge Ave Unit 9 is a home located in DuPage County with nearby schools including Georgetown Elementary School, Fischer Middle School, and Waubonsie Valley High School.
Ownership History
Date
Name
Owned For
Owner Type
Purchase Details
Closed on
Aug 11, 2016
Sold by
Negi Renu and Negi Vikram S
Bought by
Negi Renu and Negi Vik
Current Estimated Value
Home Financials for this Owner
Home Financials are based on the most recent Mortgage that was taken out on this home.
Original Mortgage
$174,500
Outstanding Balance
$11,894
Interest Rate
2.75%
Mortgage Type
New Conventional
Estimated Equity
$374,642
Purchase Details
Closed on
Aug 27, 2004
Sold by
Negi Renu
Bought by
Negi Renu and Negi Vikram S
Purchase Details
Closed on
Jul 26, 2004
Sold by
Negi Vikram S
Bought by
Negi Renu
Purchase Details
Closed on
Sep 26, 2000
Sold by
Malatia Steven J and Malatia Joanne M
Bought by
Negi Vikram S
Home Financials for this Owner
Home Financials are based on the most recent Mortgage that was taken out on this home.
Original Mortgage
$153,600
Interest Rate
7.99%
Create a Home Valuation Report for This Property
The Home Valuation Report is an in-depth analysis detailing your home's value as well as a comparison with similar homes in the area
Home Values in the Area
Average Home Value in this Area
Purchase History
We collect this data history from publicly available records. To have your information removed, we recommend requesting removal directly through your county’s website.
| Date | Buyer | Sale Price | Title Company |
|---|---|---|---|
| Negi Renu | -- | Attorney | |
| Negi Renu | -- | -- | |
| Negi Renu | -- | -- | |
| Negi Vikram S | $192,000 | Chicago Title Insurance Co |
Source: Public Records
Mortgage History
We collect this data history from publicly available records. To have your information removed, we recommend requesting removal directly through your county’s website.
| Date | Status | Borrower | Loan Amount |
|---|---|---|---|
| Open | Negi Renu | $174,500 | |
| Closed | Negi Vikram S | $153,600 |
Source: Public Records
Tax History
| Year | Tax Paid | Tax Assessment Tax Assessment Total Assessment is a certain percentage of the fair market value that is determined by local assessors to be the total taxable value of land and additions on the property. | Land | Improvement |
|---|---|---|---|---|
| 2024 | $8,398 | $118,446 | $20,422 | $98,024 |
| 2023 | $7,999 | $106,430 | $18,350 | $88,080 |
| 2022 | $6,975 | $89,170 | $16,200 | $72,970 |
| 2021 | $6,786 | $85,990 | $15,620 | $70,370 |
| 2020 | $6,869 | $85,990 | $15,620 | $70,370 |
| 2019 | $7,075 | $86,990 | $14,860 | $72,130 |
| 2018 | $6,349 | $77,880 | $13,190 | $64,690 |
| 2017 | $6,238 | $75,240 | $12,740 | $62,500 |
| 2016 | $6,122 | $72,210 | $12,230 | $59,980 |
| 2015 | $6,051 | $68,560 | $11,610 | $56,950 |
| 2014 | $6,085 | $67,070 | $11,270 | $55,800 |
| 2013 | $6,023 | $67,540 | $11,350 | $56,190 |
Source: Public Records
Map
Nearby Homes
- 2250 Bannister Ln Unit 9
- 1640 Edinburgh Ct
- 1740 Cumberland Rd Unit 8B
- 2475 Westleigh Ct
- 1410 Ashton Ct
- 2414 Savoy Ct
- 2655 Lindrick Ln
- 2509 Rosehall Ln
- 1850 Wisteria Dr Unit 343
- 1874 Keating Dr
- 1871 Keating Dr
- 1870 Keating Dr
- 1868 Keating Dr
- 1866 Keating Dr
- 1862 Keating Dr
- 1859 Keating Dr
- 1858 Keating Dr
- 1855 Keating Dr
- 2595 Autumn Grove Ct
- 1869 Misty Ridge Ln Unit 4
- 2230 Ridge Ave
- 2250 Ridge Ave Unit 9
- 2235 Bannister Ln Unit 9
- 2220 Ridge Ave Unit 9
- 2260 Ridge Ave
- 2225 Bannister Ln
- 2245 Bannister Ln
- 2270 Ridge Ave Unit 9
- 2215 Bannister Ln
- 2255 Bannister Ln
- 2265 Ridge Ave
- 2255 Ridge Ave Unit 8C
- 2245 Ridge Ave Unit 8C
- 2210 Ridge Ave
- 2265 Bannister Ln Unit 9
- 2235 Ridge Ave Unit 8C
- 2205 Bannister Ln Unit 9
- 2275 Ridge Ave Unit 8C
- 2280 Ridge Ave
- 2240 Bannister Ln
Your Personal Tour Guide
Ask me questions while you tour the home.