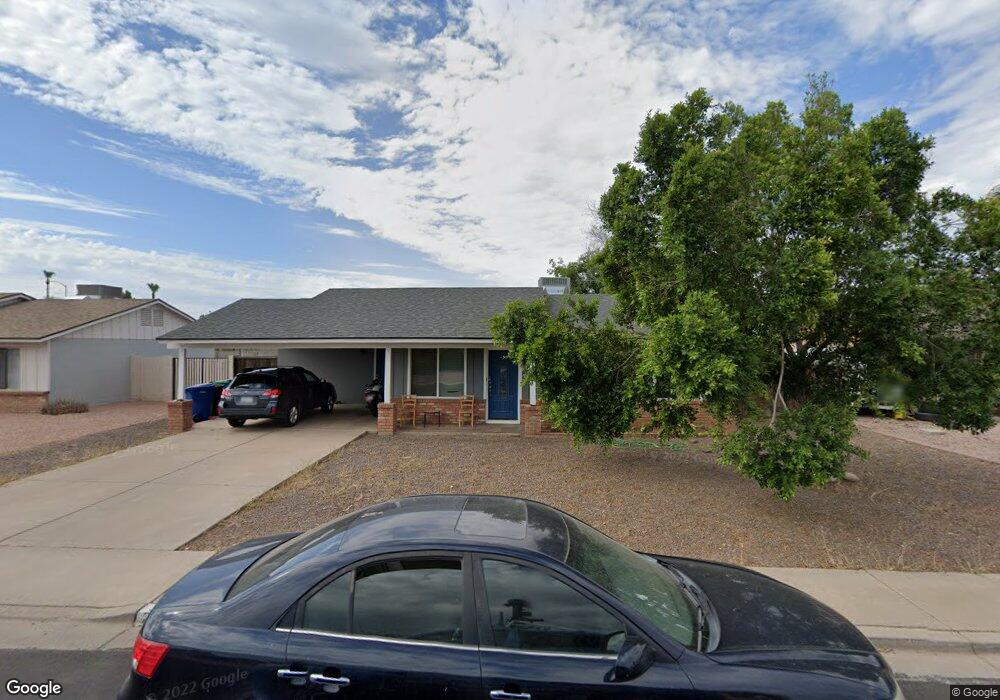
2241 E Gable Ave Mesa, AZ 85204
Central Mesa NeighborhoodEstimated Value: $318,843 - $435,000
3
Beds
2
Baths
1,168
Sq Ft
$337/Sq Ft
Est. Value
About This Home
This home is located at 2241 E Gable Ave, Mesa, AZ 85204 and is currently estimated at $393,461, approximately $336 per square foot. 2241 E Gable Ave is a home located in Maricopa County with nearby schools including Porter Elementary School, Franklin at Brimhall Elementary School, and Franklin West Elementary School.
Ownership History
Date
Name
Owned For
Owner Type
Purchase Details
Closed on
Feb 24, 2012
Sold by
Justice Michael A
Bought by
Lane Jeffrey and Lane Jessica
Current Estimated Value
Home Financials for this Owner
Home Financials are based on the most recent Mortgage that was taken out on this home.
Original Mortgage
$110,135
Outstanding Balance
$75,510
Interest Rate
3.83%
Mortgage Type
New Conventional
Estimated Equity
$317,951
Purchase Details
Closed on
Nov 21, 2011
Sold by
White Rene
Bought by
Justice Michael A
Purchase Details
Closed on
Apr 25, 2000
Sold by
Roit Paul
Bought by
White Rene
Home Financials for this Owner
Home Financials are based on the most recent Mortgage that was taken out on this home.
Original Mortgage
$106,835
Interest Rate
8.27%
Mortgage Type
FHA
Create a Home Valuation Report for This Property
The Home Valuation Report is an in-depth analysis detailing your home's value as well as a comparison with similar homes in the area
Home Values in the Area
Average Home Value in this Area
Purchase History
| Date | Buyer | Sale Price | Title Company |
|---|---|---|---|
| Lane Jeffrey | $113,000 | Old Republic Title Agency | |
| Justice Michael A | -- | Old Republic Title Agency | |
| Justice Michael A | $65,100 | None Available | |
| White Rene | $107,016 | Chicago Title Insurance Co |
Source: Public Records
Mortgage History
| Date | Status | Borrower | Loan Amount |
|---|---|---|---|
| Open | Lane Jeffrey | $110,135 | |
| Previous Owner | White Rene | $106,835 |
Source: Public Records
Tax History
| Year | Tax Paid | Tax Assessment Tax Assessment Total Assessment is a certain percentage of the fair market value that is determined by local assessors to be the total taxable value of land and additions on the property. | Land | Improvement |
|---|---|---|---|---|
| 2025 | $1,182 | $11,985 | -- | -- |
| 2024 | $1,186 | $11,414 | -- | -- |
| 2023 | $1,186 | $25,480 | $5,090 | $20,390 |
| 2022 | $1,162 | $19,460 | $3,890 | $15,570 |
| 2021 | $1,176 | $18,460 | $3,690 | $14,770 |
| 2020 | $1,160 | $17,080 | $3,410 | $13,670 |
| 2019 | $1,084 | $15,000 | $3,000 | $12,000 |
| 2018 | $1,040 | $13,620 | $2,720 | $10,900 |
| 2017 | $855 | $12,280 | $2,450 | $9,830 |
| 2016 | $839 | $11,400 | $2,280 | $9,120 |
| 2015 | $792 | $10,520 | $2,100 | $8,420 |
Source: Public Records
Map
Nearby Homes
- 2219 E Fairview Ave
- 2352 E Florian Cir
- 1525 S Chestnut Cir
- 2565 E Southern Ave Unit 24
- 2421 E Hilton Ave
- 2205 E El Moro Ave
- 1520 S Gaylord
- 1927 E Hampton Ave Unit 207
- 1927 E Hampton Ave Unit 258
- 1927 E Hampton Ave Unit 212
- 2210 E Edgewood Ave
- 1356 S Yale
- 1301 S Hall
- 763 S Alamo
- 2601 E Hopi Ave
- 1832 E Enid Ave
- 1756 E Harmony Ave
- 1713 E Gable Ave
- 2226 E Diamond Ave
- 1626 E Garnet Ave
- 2235 E Gable Ave
- 2249 E Gable Ave
- 2249 E Gable Ave Unit 1
- 2240 E Garnet Ave
- 2229 E Gable Ave
- 2255 E Gable Ave
- 2236 E Garnet Ave
- 1230 S Briar Unit CUTIE!
- 1230 S Briar
- 2246 E Gable Ave
- 2238 E Gable Ave
- 2252 E Gable Ave
- 2232 E Gable Ave
- 1238 S Briar
- 2221 E Gable Ave
- 2242 E Garnet Ave Unit 1
- 2258 E Gable Ave
- 2258 E Gable Ave
- 2228 E Garnet Ave
- 2224 E Gable Ave
Your Personal Tour Guide
Ask me questions while you tour the home.