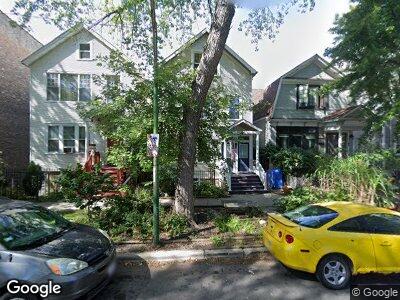
2242 N Maplewood Ave Unit 2 Chicago, IL 60647
Logan Square NeighborhoodEstimated Value: $368,000 - $705,000
2
Beds
2
Baths
1,880
Sq Ft
$275/Sq Ft
Est. Value
About This Home
This home is located at 2242 N Maplewood Ave Unit 2, Chicago, IL 60647 and is currently estimated at $517,023, approximately $275 per square foot. 2242 N Maplewood Ave Unit 2 is a home located in Cook County with nearby schools including Goethe Elementary School, Clemente Community Academy High School, and CICS - Bucktown Campus.
Ownership History
Date
Name
Owned For
Owner Type
Purchase Details
Closed on
Jul 28, 2004
Sold by
Holland Jeffrey A and Holland Margot B
Bought by
Lucas Tracy and Lucas Robert G
Current Estimated Value
Home Financials for this Owner
Home Financials are based on the most recent Mortgage that was taken out on this home.
Original Mortgage
$351,000
Outstanding Balance
$185,827
Interest Rate
6.08%
Mortgage Type
Credit Line Revolving
Estimated Equity
$311,067
Purchase Details
Closed on
Oct 31, 2002
Sold by
Newport Development Inc
Bought by
Holland Jeffrey A and Burke Holland Margot E
Home Financials for this Owner
Home Financials are based on the most recent Mortgage that was taken out on this home.
Original Mortgage
$250,000
Interest Rate
5.25%
Create a Home Valuation Report for This Property
The Home Valuation Report is an in-depth analysis detailing your home's value as well as a comparison with similar homes in the area
Home Values in the Area
Average Home Value in this Area
Purchase History
| Date | Buyer | Sale Price | Title Company |
|---|---|---|---|
| Lucas Tracy | $387,500 | First American | |
| Holland Jeffrey A | $351,500 | Chicago Title Insurance Co |
Source: Public Records
Mortgage History
| Date | Status | Borrower | Loan Amount |
|---|---|---|---|
| Open | Lucas Tracy | $351,000 | |
| Previous Owner | Holland Jeffrey A | $250,000 |
Source: Public Records
Tax History Compared to Growth
Tax History
| Year | Tax Paid | Tax Assessment Tax Assessment Total Assessment is a certain percentage of the fair market value that is determined by local assessors to be the total taxable value of land and additions on the property. | Land | Improvement |
|---|---|---|---|---|
| 2024 | $6,445 | $34,992 | $6,489 | $28,503 |
| 2023 | $6,445 | $34,650 | $2,955 | $31,695 |
| 2022 | $6,445 | $34,650 | $2,955 | $31,695 |
| 2021 | $17,635 | $90,739 | $2,954 | $87,785 |
| 2020 | $6,646 | $32,827 | $2,954 | $29,873 |
| 2019 | $6,631 | $36,316 | $2,954 | $33,362 |
| 2018 | $6,495 | $36,316 | $2,954 | $33,362 |
| 2017 | $6,076 | $31,601 | $2,607 | $28,994 |
| 2016 | $5,829 | $31,601 | $2,607 | $28,994 |
| 2015 | $5,310 | $31,601 | $2,607 | $28,994 |
| 2014 | $3,889 | $23,527 | $2,346 | $21,181 |
| 2013 | $3,801 | $23,527 | $2,346 | $21,181 |
Source: Public Records
Map
Nearby Homes
- 2535 W Belden Ave
- 2215 N Talman Ave
- 2512 W Lyndale St
- 2212 N Campbell Ave Unit 2A
- 2331 N Talman Ave
- 2638 W Lyndale St
- 2342 N Rockwell St
- 2735 N Campbell Ave
- 2550 W Fullerton Ave Unit 4D
- 2659 W Medill Ave
- 2661 W Medill Ave
- 2133 N Campbell Ave Unit 2C
- 2133 N Campbell Ave Unit 2A
- 2429-2431 W Fullerton Ave
- 2654 W Medill Ave Unit 202
- 2654 W Medill Ave Unit 302
- 2654 W Medill Ave Unit 101
- 2109 N Campbell Ave Unit 2N
- 2413 W Fullerton Ave Unit 3
- 2428 N Campbell Ave
- 2242 N Maplewood Ave Unit 2
- 2242 N Maplewood Ave Unit 1
- 2242 N Maplewood Ave Unit P2
- 2242 N Maplewood Ave Unit P1
- 2240 N Maplewood Ave
- 2244 N Maplewood Ave
- 2248 N Maplewood Ave
- 2236 N Maplewood Ave Unit 3
- 2236 N Maplewood Ave Unit 2
- 2250 N Maplewood Ave
- 2234 N Maplewood Ave Unit 3
- 2234 N Maplewood Ave Unit 3
- 2234 N Maplewood Ave Unit 1
- 2254 N Maplewood Ave
- 2241 N Maplewood Ave
- 2258 N Maplewood Ave
- 2258 N Maplewood Ave Unit 3
- 2258 N Maplewood Ave Unit 2
- 2258 N Maplewood Ave Unit 1
- 2574 W Lyndale St Unit 25742