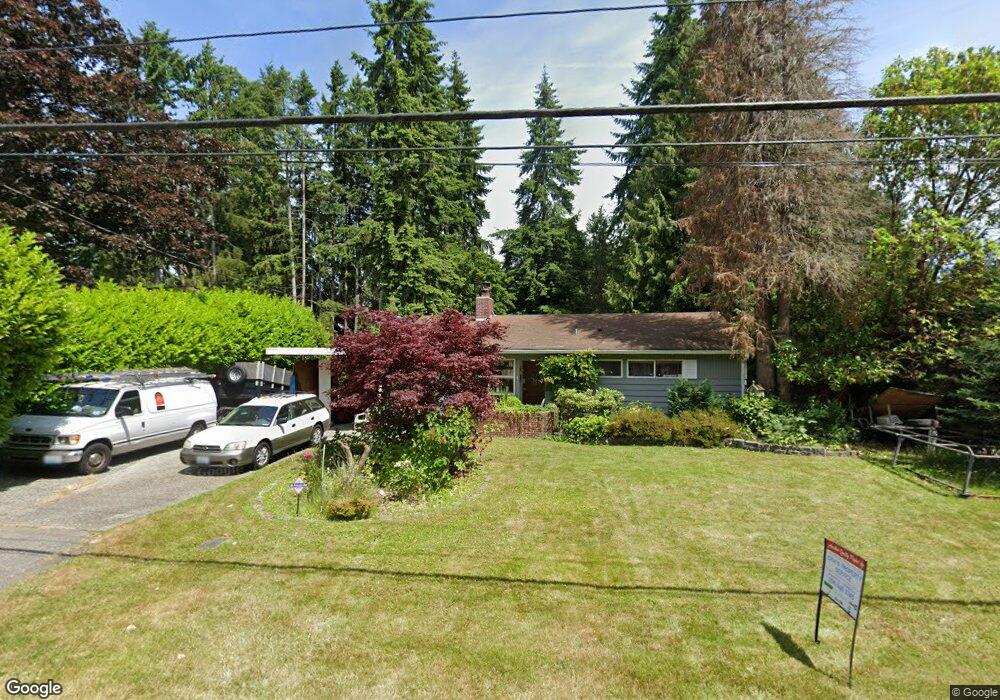
22421 95th Place W Edmonds, WA 98020
Westgate NeighborhoodEstimated Value: $700,000 - $823,000
2
Beds
1
Bath
1,135
Sq Ft
$685/Sq Ft
Est. Value
About This Home
This home is located at 22421 95th Place W, Edmonds, WA 98020 and is currently estimated at $777,222, approximately $684 per square foot. 22421 95th Place W is a home located in Snohomish County with nearby schools including Westgate Elementary School, College Place Middle School, and Edmonds-Woodway High School.
Ownership History
Date
Name
Owned For
Owner Type
Purchase Details
Closed on
Nov 7, 2017
Sold by
Morris Erik and Morris Patricia
Bought by
Morriss Erik
Current Estimated Value
Home Financials for this Owner
Home Financials are based on the most recent Mortgage that was taken out on this home.
Original Mortgage
$305,000
Outstanding Balance
$255,778
Interest Rate
3.88%
Mortgage Type
New Conventional
Estimated Equity
$521,444
Purchase Details
Closed on
May 31, 2007
Sold by
Morriss Shannon
Bought by
Morriss Erik
Purchase Details
Closed on
Mar 29, 1995
Sold by
Prater Sandra
Bought by
Profit John C and Profit Denise A
Home Financials for this Owner
Home Financials are based on the most recent Mortgage that was taken out on this home.
Original Mortgage
$97,450
Interest Rate
8.9%
Create a Home Valuation Report for This Property
The Home Valuation Report is an in-depth analysis detailing your home's value as well as a comparison with similar homes in the area
Home Values in the Area
Average Home Value in this Area
Purchase History
| Date | Buyer | Sale Price | Title Company |
|---|---|---|---|
| Morriss Erik | -- | Title Source Inc | |
| Morriss Erik | -- | None Available | |
| Profit John C | $129,950 | Transamerica Title Ins Co |
Source: Public Records
Mortgage History
| Date | Status | Borrower | Loan Amount |
|---|---|---|---|
| Open | Morriss Erik | $305,000 | |
| Closed | Profit John C | $97,450 | |
| Closed | Profit John C | $19,492 |
Source: Public Records
Tax History Compared to Growth
Tax History
| Year | Tax Paid | Tax Assessment Tax Assessment Total Assessment is a certain percentage of the fair market value that is determined by local assessors to be the total taxable value of land and additions on the property. | Land | Improvement |
|---|---|---|---|---|
| 2025 | $4,997 | $733,200 | $621,300 | $111,900 |
| 2024 | $4,997 | $700,900 | $586,900 | $114,000 |
| 2023 | $5,053 | $734,500 | $611,100 | $123,400 |
| 2022 | $5,104 | $610,200 | $515,100 | $95,100 |
| 2020 | $4,664 | $498,600 | $403,500 | $95,100 |
| 2019 | $4,310 | $464,100 | $370,500 | $93,600 |
| 2018 | $4,304 | $400,500 | $316,200 | $84,300 |
| 2017 | $3,592 | $349,800 | $274,500 | $75,300 |
| 2016 | $3,257 | $314,200 | $241,500 | $72,700 |
| 2015 | $3,413 | $310,000 | $232,800 | $77,200 |
| 2013 | $2,532 | $216,800 | $146,500 | $70,300 |
Source: Public Records
Map
Nearby Homes
- 9511 Edmonds Way
- 22212 98th Ave W
- 7522 221st St SW
- 23015 Edmonds Way Unit A103
- 22039 98th Place W
- 22910 90th Ave W Unit C306
- 23121 Edmonds Way Unit 2
- 23024 99th Ave W
- 1221 Coronado Place
- 8825 231st Place SW
- 23227 92nd Ave W
- 21703 97th Ave W
- 9801 234th St SW Unit 1
- 9526 234th St SW
- 23511 96th Ave W
- 637 Elm Place
- 8614 Madrona Ln
- 21232 92nd Place W
- 23601 Edmonds Way
- 22628 106th Ave W
- 22413 95th Place W
- 22507 95th Place W
- 22511 95th Place W
- 22409 95th Place W
- 22420 93rd Place W
- 22416 93rd Place W
- 22506 93rd Place W
- 9402 224th St SW
- 22515 95th Place W
- 22510 93rd Place W
- 22405 95th Place W
- 22420 95th Place W
- 22506 95th Place W
- 22412 95th Place W
- 22408 95th Place W
- 9316 224th St SW
- 22408 93rd Place W
- 22510 95th Place W
- 22514 93rd Place W
- 9502 224th St SW