NOT LISTED FOR SALE

2243 Willette Rd Red Boiling Springs, TN 37150

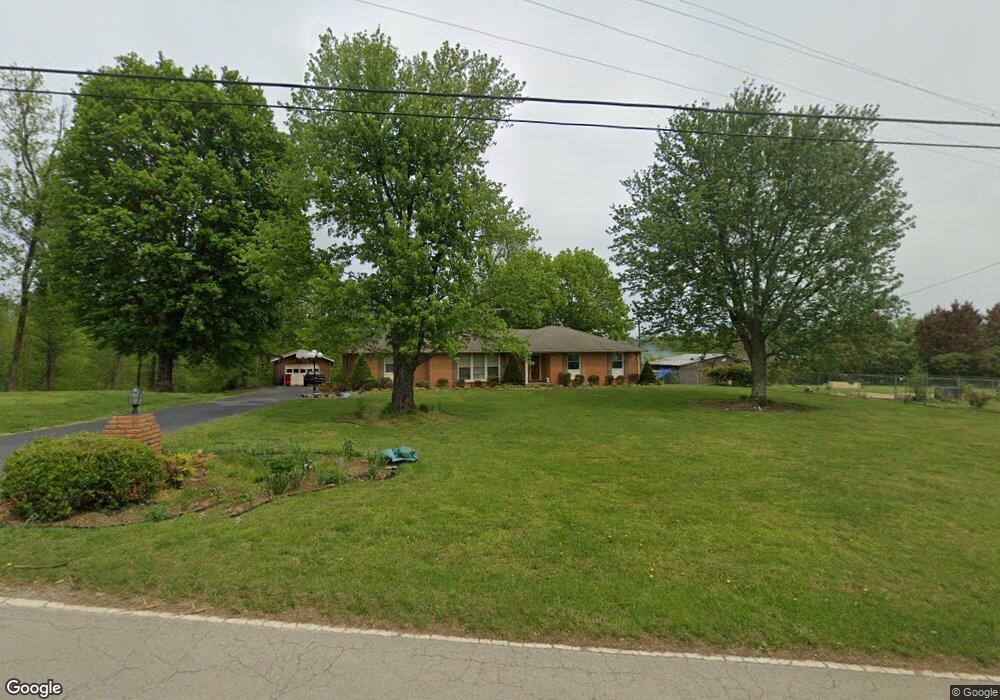
Estimated Value: $258,000 - $283,545

3 Beds
2 Baths
1,508 Sq Ft
$176/Sq Ft Est. Value

Last Sold December 30, 2016

Last sale price $139,900 $93 Per Sq Ft

Est. 90% increase in value since last sale

Current estimated payment $1,448/month

About This Home

Well maintained home on 2 acres with barn. 3 bedroom 2 bath w/ eat in kitchen, den and formal livingroom. Kitchen has tons of custom cabinets and bar area. Large barn and storage buildings for your animals, boat, etc. Close to several boat docks.

Ownership History

Date Name Owned For Owner Type

Purchase Details

Closed on
Oct 15, 2021
Sold by
Rich Jackie and Rich Sherry
Bought by
Carroll Mathew and Carroll Michelle
Current Estimated Value
$265,636

Purchase Details

Listed on
Feb 6, 2016
Closed on
Dec 30, 2016
Sold by
Shutak Rick
Bought by
Carroll Mathew
Seller's Agent
Trace Jenkins
Crye-Leike Realtors
Buyer's Agent
Trace Jenkins
Crye-Leike Realtors
Sold Price
$139,900

Home Financials for this Owner

Home Financials are based on the most recent Mortgage that was taken out on this home.
Avg. Annual Appreciation
7.53%
Original Mortgage
$135,650
Interest Rate
4.08%
Mortgage Type
New Conventional

Purchase Details

Closed on
Jul 2, 2014
Sold by
Fleming Gerald
Bought by
Shutak Rick and Colgan Irene

Purchase Details

Closed on
Nov 30, 1985
Bought by
Fleming Gerald and Fleming Fonda
Source: Public Records

Range of Values:

Collateral Analytics

Collateral Analytics Collateral Analytics AVMs (Automated Valuation Model) employ a number of statistical approaches combined with neighborhood-specific comparable selection guarantees the most up-to-date and precise valuations.

Not Available

Collateral Analytics does not have data for the current month. Please view the chart for historical values.

ICE

ICE Mortgage Technology ICE Mortgage Technology’s AVM (Automated Valuation Model) is a state-of-the-art online residential property valuation tool that provides a quick and accurate estimate of the value of almost any home in the U.S.

Not Available

ICE Mortgage Technology does not have data for the current month. Please view the chart for historical values.

First American

First American First American Data & Analytics’ next-generation AVM combines unrivaled data assets with a blended ensemble of valuation models to produce highly accurate, reliable valuations you can trust.

Not Available

First American does not have data for the current month. Please view the chart for historical values.

Quantarium

Quantarium Quantarium’s valuation service, repeatedly proven the industry’s most accurate and comprehensive, is supercharged with a self-learning and auto-tuning AI engine that continually becomes smarter and more accurate as it processes daily inputs from the industry’s leading RE data lake.

Not Available

Quantarium does not have data for the current month. Please view the chart for historical values.

Average Value
Not Available
List Price
Sold Price
Create a Home Valuation Report for This Property
The Home Valuation Report is an in-depth analysis detailing your home's value as well as a comparison with similar homes in the area

Home Values in the Area

Source: Public Records

Average Home Value in this Area


Source: Public Records

Purchase History

Date Buyer Sale Price Title Company
Carroll Mathew $14,458 None Available
Carroll Mathew $139,900 --
Shutak Rick $134,900 --
Fleming Gerald -- --
Source: Public Records

Mortgage History

Date Status Borrower Loan Amount
Previous Owner Carroll Mathew $135,650
Source: Public Records

Property History

Date Event Price List to Sale Price per Sq Ft Prior Sale
12/30/2016 12/30/16 Sold $139,900 0.0% $93 / Sq Ft View Prior Sale
01/01/1970 01/01/70 Off Market $139,900 -- --

Tax History Compared to Growth

Source: Public Records

Tax History

Year Tax Paid Tax Assessment Tax Assessment Total Assessment is a certain percentage of the fair market value that is determined by local assessors to be the total taxable value of land and additions on the property. Land Improvement
2024 $697 $49,350 $6,075 $43,275
2023 $697 $49,350 $0 $0
2022 $677 $28,225 $3,450 $24,775
2021 $677 $28,225 $3,450 $24,775
2020 $677 $28,225 $3,450 $24,775
2019 $677 $28,225 $3,450 $24,775
2018 $625 $28,225 $3,450 $24,775
2017 $670 $22,225 $2,650 $19,575
2016 $533 $22,225 $2,650 $19,575
2015 $533 $22,225 $2,650 $19,575
2014 $533 $22,227 $0 $0
Source: Public Records

Agents Affiliated with this Home

  • Section Image
See All Agents

Map