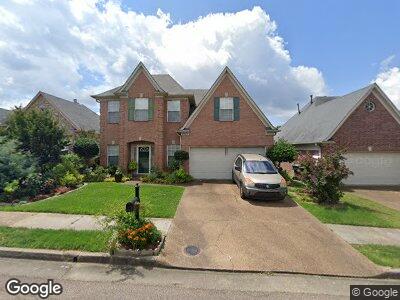
2245 Coral Tree Ln Cordova, TN 38016
Estimated Value: $240,000 - $269,000
3
Beds
3
Baths
2,203
Sq Ft
$116/Sq Ft
Est. Value
About This Home
This home is located at 2245 Coral Tree Ln, Cordova, TN 38016 and is currently estimated at $255,192, approximately $115 per square foot. 2245 Coral Tree Ln is a home located in Shelby County with nearby schools including Chimneyrock Elementary School, Cordova High School, and Kate Bond Middle School.
Ownership History
Date
Name
Owned For
Owner Type
Purchase Details
Closed on
Feb 25, 2010
Sold by
The Bank Of New York Mellon
Bought by
Brown Steven Christopher
Current Estimated Value
Home Financials for this Owner
Home Financials are based on the most recent Mortgage that was taken out on this home.
Original Mortgage
$92,297
Interest Rate
5.58%
Mortgage Type
FHA
Purchase Details
Closed on
Jan 19, 2010
Sold by
Gray Trina W
Bought by
The Bank Of New York Mellon and The Bank Of New York
Home Financials for this Owner
Home Financials are based on the most recent Mortgage that was taken out on this home.
Original Mortgage
$92,297
Interest Rate
5.58%
Mortgage Type
FHA
Purchase Details
Closed on
Dec 30, 2003
Sold by
Mark Matthews Development Llc
Bought by
Gray Trina W
Home Financials for this Owner
Home Financials are based on the most recent Mortgage that was taken out on this home.
Original Mortgage
$156,900
Interest Rate
6.92%
Mortgage Type
Purchase Money Mortgage
Create a Home Valuation Report for This Property
The Home Valuation Report is an in-depth analysis detailing your home's value as well as a comparison with similar homes in the area
Home Values in the Area
Average Home Value in this Area
Purchase History
| Date | Buyer | Sale Price | Title Company |
|---|---|---|---|
| Brown Steven Christopher | $94,000 | Realty Title & Escrow Co | |
| The Bank Of New York Mellon | $103,470 | None Available | |
| Gray Trina W | $157,575 | -- |
Source: Public Records
Mortgage History
| Date | Status | Borrower | Loan Amount |
|---|---|---|---|
| Open | Brown Steven Christopher | $90,455 | |
| Closed | Brown Steven Christopher | $92,297 | |
| Previous Owner | Gray Trina W | $19,146 | |
| Previous Owner | Gray Trina W | $156,900 |
Source: Public Records
Tax History Compared to Growth
Tax History
| Year | Tax Paid | Tax Assessment Tax Assessment Total Assessment is a certain percentage of the fair market value that is determined by local assessors to be the total taxable value of land and additions on the property. | Land | Improvement |
|---|---|---|---|---|
| 2025 | $1,746 | $70,625 | $12,000 | $58,625 |
| 2024 | $1,746 | $51,500 | $6,875 | $44,625 |
| 2023 | $3,137 | $51,500 | $6,875 | $44,625 |
| 2022 | $3,137 | $51,500 | $6,875 | $44,625 |
| 2021 | $3,174 | $51,500 | $6,875 | $44,625 |
| 2020 | $2,623 | $36,200 | $6,875 | $29,325 |
| 2019 | $2,623 | $36,200 | $6,875 | $29,325 |
| 2018 | $2,623 | $36,200 | $6,875 | $29,325 |
| 2017 | $1,488 | $36,200 | $6,875 | $29,325 |
| 2016 | $1,260 | $28,825 | $0 | $0 |
| 2014 | $1,260 | $28,825 | $0 | $0 |
Source: Public Records
Map
Nearby Homes
- 2247 Applemill Dr
- 0 Berryhill Rd Unit 10185975
- 2275 Applemill Dr
- 2280 Lake Hill Ct
- 2339 Meverett Ln
- 2268 Lake Springs Ln
- 9051 S Wilderwood Ln
- 2216 Lake Springs Ln
- 2148 Valley Edge Dr
- 8944 Meadow Pines Cove
- 8893 Lindstrom Dr
- 2370 Red Vintage Ln
- 9275 Windy Meadow Ln
- 8915 Johnston St
- 2275 Pendrell Ln
- 2024 Wirily Ln
- 2424 Red Vintage Cove
- 1937 Ada Ln
- 8721 Grandbury Place
- 2144 Brackenbury Ln
- 2245 Coral Tree Ln
- 2249 Coral Tree Ln
- 2241 Coral Tree Ln
- 2253 Coral Tree Ln
- 9058 Snow Drift Ln
- 9054 Snow Drift Ln
- 9064 Snow Drift Ln
- 2257 Coral Tree Ln
- 2244 Coral Tree Ln
- 9078 Snow Drift Ln
- 2248 Coral Tree Ln
- 9048 Snow Drift Ln
- 2252 Coral Tree Ln
- 2232 Coral Tree Cove
- 2236 Coral Tree Cove
- 9044 Snow Drift Ln
- 2228 Coral Tree Cove
- 2236 Coral Tree Ln
- 2228 Coral Tree Ln
- 2240 Coral Tree Ln