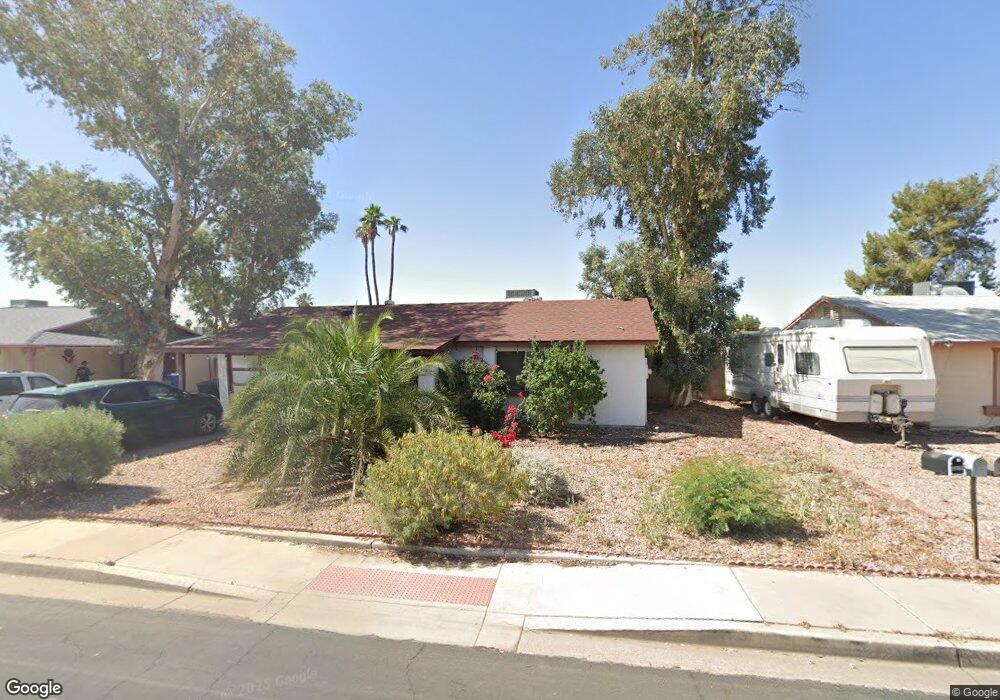
2247 E Inverness Ave Mesa, AZ 85204
Central Mesa NeighborhoodEstimated Value: $332,759 - $422,000
--
Bed
2
Baths
1,170
Sq Ft
$324/Sq Ft
Est. Value
About This Home
This home is located at 2247 E Inverness Ave, Mesa, AZ 85204 and is currently estimated at $379,190, approximately $324 per square foot. 2247 E Inverness Ave is a home located in Maricopa County with nearby schools including Harris Elementary School, Mesquite Junior High School, and Montessori Education Centre Charter School.
Ownership History
Date
Name
Owned For
Owner Type
Purchase Details
Closed on
Sep 27, 2006
Sold by
Strickler Jon M
Bought by
Strickler Susan A
Current Estimated Value
Purchase Details
Closed on
Aug 19, 1997
Sold by
Oliver Richard A and Oliver Sandra L
Bought by
Strickler Jon M and Strickler Susan A
Home Financials for this Owner
Home Financials are based on the most recent Mortgage that was taken out on this home.
Original Mortgage
$81,750
Interest Rate
7.54%
Purchase Details
Closed on
Jun 27, 1994
Sold by
Hilbrands Theodore S and Hilbrands Dawn Renee
Bought by
Oliver Richard A and Oliver Sandra L
Home Financials for this Owner
Home Financials are based on the most recent Mortgage that was taken out on this home.
Original Mortgage
$64,417
Interest Rate
8.57%
Mortgage Type
FHA
Create a Home Valuation Report for This Property
The Home Valuation Report is an in-depth analysis detailing your home's value as well as a comparison with similar homes in the area
Home Values in the Area
Average Home Value in this Area
Purchase History
| Date | Buyer | Sale Price | Title Company |
|---|---|---|---|
| Strickler Susan A | -- | None Available | |
| Strickler Jon M | $86,100 | First American Title | |
| Oliver Richard A | $68,000 | Fidelity Title |
Source: Public Records
Mortgage History
| Date | Status | Borrower | Loan Amount |
|---|---|---|---|
| Previous Owner | Strickler Jon M | $81,750 | |
| Previous Owner | Oliver Richard A | $64,417 |
Source: Public Records
Tax History Compared to Growth
Tax History
| Year | Tax Paid | Tax Assessment Tax Assessment Total Assessment is a certain percentage of the fair market value that is determined by local assessors to be the total taxable value of land and additions on the property. | Land | Improvement |
|---|---|---|---|---|
| 2025 | $726 | $9,821 | -- | -- |
| 2024 | $705 | $9,353 | -- | -- |
| 2023 | $705 | $26,580 | $5,310 | $21,270 |
| 2022 | $688 | $19,480 | $3,890 | $15,590 |
| 2021 | $745 | $19,330 | $3,860 | $15,470 |
| 2020 | $732 | $17,050 | $3,410 | $13,640 |
| 2019 | $678 | $15,900 | $3,180 | $12,720 |
| 2018 | $646 | $14,320 | $2,860 | $11,460 |
| 2017 | $625 | $13,120 | $2,620 | $10,500 |
| 2016 | $648 | $12,480 | $2,490 | $9,990 |
| 2015 | $594 | $9,900 | $1,980 | $7,920 |
Source: Public Records
Map
Nearby Homes
- 1668 S Briar
- 2220 E Jerome Ave
- 2137 E Inverness Ave
- 2209 E Jerome Ave
- 2338 E Javelina Ave
- 1866 S 24th St
- 2415 E Jacinto Ave
- 2454 E Javelina Ave
- 2259 E Harmony Ave
- 1650 S Windsor
- 2514 E Jacinto Ave
- 1934 E Inverness Ave
- 1926 E Inverness Ave
- 1927 E Hampton Ave Unit 263
- 1927 E Hampton Ave Unit 116
- 1927 E Hampton Ave Unit 260
- 1500 N Sunview Pkwy Unit 28
- 2205 E Garnet Ave
- 1425 N Ironwood St
- 1711 S Hall
- 2303 E Inverness Ave
- 2241 E Inverness Ave
- 2242 E Juanita Ave
- 2248 E Juanita Ave
- 2234 E Juanita Ave
- 2311 E Inverness Ave
- 2302 E Juanita Ave
- 2304 E Inverness Ave
- 2226 E Juanita Ave
- 2317 E Inverness Ave
- 2225 E Inverness Ave
- 1663 S Rose Cir
- 2310 E Inverness Ave
- 1662 S Briar
- 2306 E Juanita Ave
- 1665 S Briar
- 2243 E Juanita Ave
- 2235 E Juanita Ave
- 2218 E Juanita Ave
- 2323 E Inverness Ave