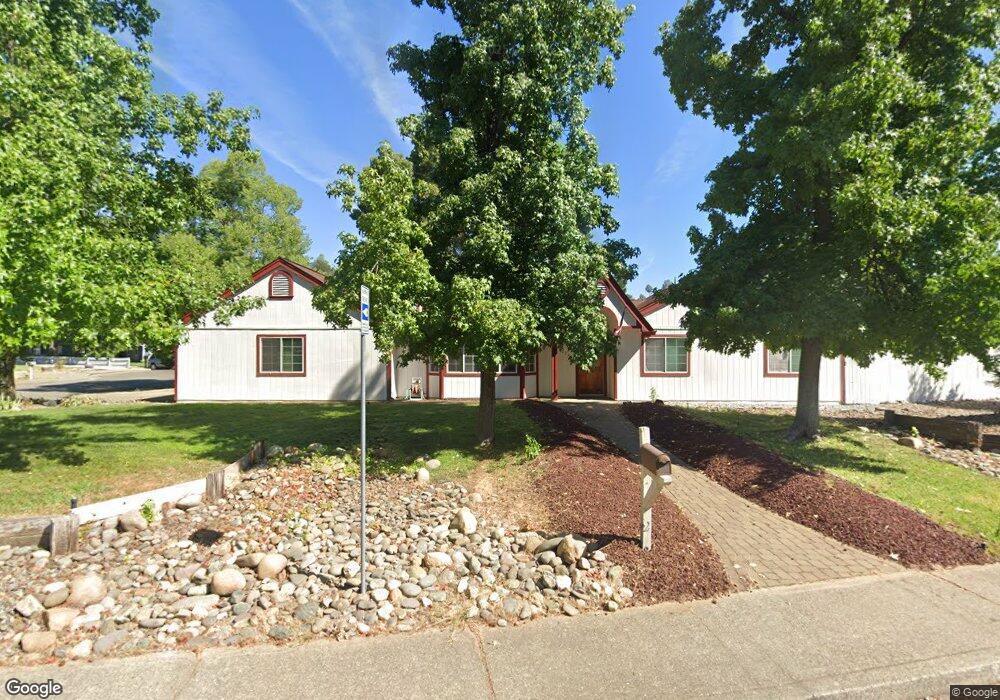
2248 Harlan Dr Redding, CA 96003
Lake Redding NeighborhoodEstimated Value: $348,000 - $380,000
3
Beds
2
Baths
1,322
Sq Ft
$277/Sq Ft
Est. Value
About This Home
This home is located at 2248 Harlan Dr, Redding, CA 96003 and is currently estimated at $365,962, approximately $276 per square foot. 2248 Harlan Dr is a home located in Shasta County with nearby schools including Turtle Bay, Sequoia Middle School, and Shasta High School.
Ownership History
Date
Name
Owned For
Owner Type
Purchase Details
Closed on
Feb 20, 2019
Sold by
Lopez Arthur J
Bought by
Thurber James H
Current Estimated Value
Home Financials for this Owner
Home Financials are based on the most recent Mortgage that was taken out on this home.
Original Mortgage
$216,000
Outstanding Balance
$189,515
Interest Rate
4.4%
Mortgage Type
New Conventional
Estimated Equity
$176,447
Purchase Details
Closed on
Jan 3, 2002
Sold by
Reynolds Charles R
Bought by
Reynolds Carole J
Purchase Details
Closed on
Apr 20, 1998
Sold by
Geiger Roland George
Bought by
Lopez Arthur J
Home Financials for this Owner
Home Financials are based on the most recent Mortgage that was taken out on this home.
Original Mortgage
$82,080
Interest Rate
7.15%
Create a Home Valuation Report for This Property
The Home Valuation Report is an in-depth analysis detailing your home's value as well as a comparison with similar homes in the area
Home Values in the Area
Average Home Value in this Area
Purchase History
| Date | Buyer | Sale Price | Title Company |
|---|---|---|---|
| Thurber James H | $240,000 | Fidelity Natl Title Co Of Ca | |
| Reynolds Carole J | -- | First American Title Co | |
| Lopez Arthur J | $103,000 | First American Title Co |
Source: Public Records
Mortgage History
| Date | Status | Borrower | Loan Amount |
|---|---|---|---|
| Open | Thurber James H | $216,000 | |
| Previous Owner | Lopez Arthur J | $82,080 |
Source: Public Records
Tax History Compared to Growth
Tax History
| Year | Tax Paid | Tax Assessment Tax Assessment Total Assessment is a certain percentage of the fair market value that is determined by local assessors to be the total taxable value of land and additions on the property. | Land | Improvement |
|---|---|---|---|---|
| 2025 | $3,182 | $314,413 | $61,351 | $253,062 |
| 2024 | $3,133 | $308,249 | $60,149 | $248,100 |
| 2023 | $3,133 | $302,206 | $58,970 | $243,236 |
| 2022 | $3,079 | $296,281 | $57,814 | $238,467 |
| 2021 | $2,602 | $247,335 | $56,681 | $190,654 |
| 2020 | $2,651 | $244,800 | $56,100 | $188,700 |
| 2019 | $1,589 | $146,836 | $48,657 | $98,179 |
| 2018 | $1,603 | $143,957 | $47,703 | $96,254 |
| 2017 | $1,595 | $141,135 | $46,768 | $94,367 |
| 2016 | $1,544 | $138,368 | $45,851 | $92,517 |
| 2015 | $1,524 | $136,291 | $45,163 | $91,128 |
| 2014 | $1,514 | $133,622 | $44,279 | $89,343 |
Source: Public Records
Map
Nearby Homes
- 2520 Snow Ln
- 2350 Amethyst Way
- 476 Aquamarine Way
- 2872 Harlan Dr
- 1836 Del Mar Ave
- 656 West St
- 1840 8th St
- 625 Mary St
- 418 Moonstone Way
- 830 West St
- 755 Christine Ave
- 490 Turquoise Ct
- 1144 Willis St
- 500-550 Quartz Hill Rd
- 1170 Orange Ave
- 1514 Benton Dr
- 866 Pioneer Dr
- 1259 1261 Magnolia Ave
- 1550 Barbara Rd
- 802 Palatine Ct
- 437 Marble Ct
- 2217 Harlan Dr
- 469 Marble Ct
- 2249 Harlan Dr
- 2338 Harlan Dr
- 2287 Harlan Dr
- 438 Marble Ct
- 490 Marble Ct
- 2309 Harlan Dr
- 466 Marble Ct
- 366 Elk Dr Unit 1A
- 2215 Snow Ln
- 369 Travertine Ct Unit 1
- 369 Travertine Ct
- 2255 Snow Ln
- 2347 Harlan Dr
- 344 Elk Dr Unit 1
- 344 Elk Dr
- 2309 Snow Ln
- 380 Travertine Ct