225 6th St Waukee, IA 50263
Estimated Value: $239,000 - $304,000
4
Beds
2
Baths
1,738
Sq Ft
$158/Sq Ft
Est. Value
About This Home
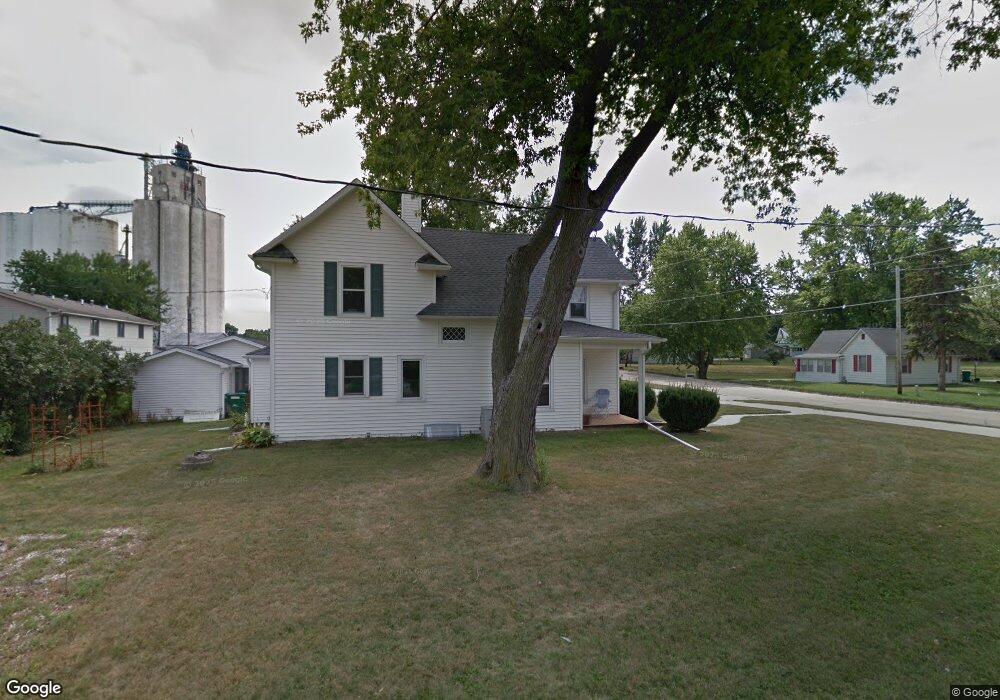
This home is located at 225 6th St, Waukee, IA 50263 and is currently estimated at $274,754, approximately $158 per square foot. 225 6th St is a home located in Dallas County with nearby schools including Waukee Elementary School, Prairieview Middle School, and Timberline School.
Ownership History
Date
Name
Owned For
Owner Type
Purchase Details
Closed on
Oct 29, 2021
Sold by
Goergen Jonathan R
Bought by
Olson Nathan A
Current Estimated Value
Home Financials for this Owner
Home Financials are based on the most recent Mortgage that was taken out on this home.
Original Mortgage
$199,813
Outstanding Balance
$181,637
Interest Rate
2.88%
Mortgage Type
FHA
Estimated Equity
$93,117
Purchase Details
Closed on
Aug 30, 2016
Sold by
Goergen Megan L
Bought by
Goergen Jonathan R
Create a Home Valuation Report for This Property
The Home Valuation Report is an in-depth analysis detailing your home's value as well as a comparison with similar homes in the area
Home Values in the Area
Average Home Value in this Area
Purchase History
| Date | Buyer | Sale Price | Title Company |
|---|---|---|---|
| Olson Nathan A | $203,500 | None Available | |
| Goergen Jonathan R | -- | None Available |
Source: Public Records
Mortgage History
| Date | Status | Borrower | Loan Amount |
|---|---|---|---|
| Open | Olson Nathan A | $199,813 |
Source: Public Records
Tax History
| Year | Tax Paid | Tax Assessment Tax Assessment Total Assessment is a certain percentage of the fair market value that is determined by local assessors to be the total taxable value of land and additions on the property. | Land | Improvement |
|---|---|---|---|---|
| 2025 | $3,498 | $236,040 | $60,000 | $176,040 |
| 2024 | $3,682 | $219,620 | $51,000 | $168,620 |
| 2023 | $3,682 | $219,620 | $51,000 | $168,620 |
| 2022 | $3,678 | $198,380 | $51,000 | $147,380 |
| 2021 | $3,678 | $203,710 | $45,900 | $157,810 |
| 2020 | $3,610 | $193,200 | $45,900 | $147,300 |
| 2019 | $3,590 | $193,200 | $45,900 | $147,300 |
| 2018 | $3,590 | $183,120 | $45,900 | $137,220 |
| 2017 | $3,262 | $178,650 | $33,000 | $145,650 |
| 2016 | $3,028 | $167,310 | $33,000 | $134,310 |
| 2015 | $2,944 | $159,970 | $0 | $0 |
| 2014 | $2,368 | $134,620 | $0 | $0 |
Source: Public Records
Map
Nearby Homes
- 620 Locust St
- 615 6th St
- 310 Ashworth Dr
- 4601 178th St
- 453 Spring Crest Ln
- 1003 Daisy Ln
- 1005 Daisy Ln
- 431 Kinley Dr
- 260 Ashworth Dr
- 248 NW Common Place
- 561 10th St
- 1038 Maple St
- 1042 Maple St
- 1033 Daisy Ln
- 485 NW Ryder Dr
- 234 NW Common Place
- 1044 Maple St
- 1035 Daisy Ln
- 1046 Maple St
- 645 NW Compass Ave
Your Personal Tour Guide
Ask me questions while you tour the home.