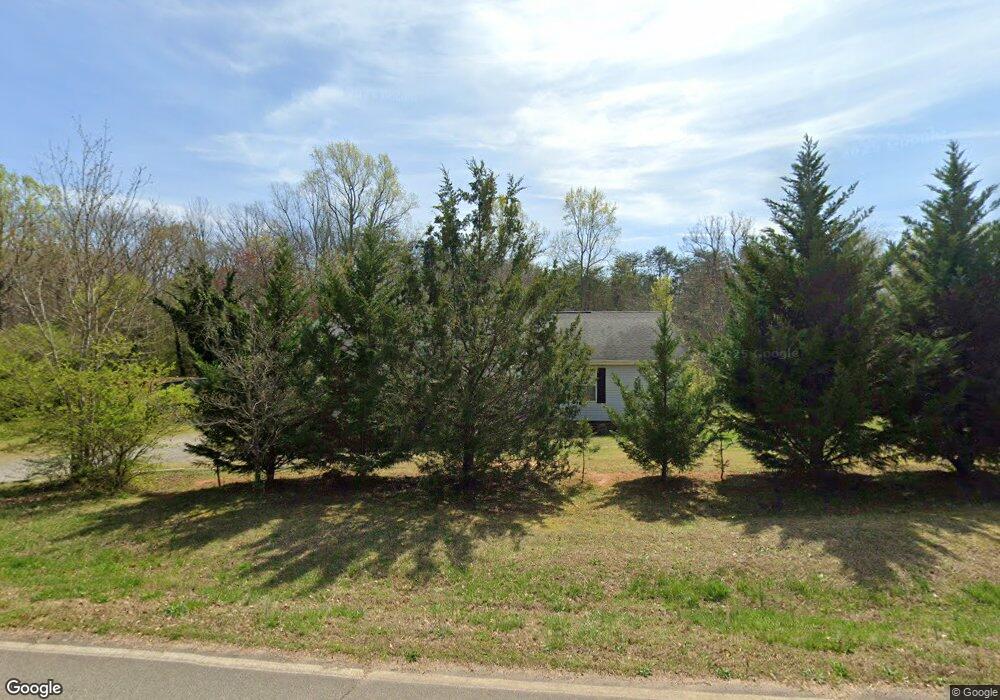
225 Bynum Rd Lincolnton, NC 28092
Estimated Value: $188,000 - $336,000
3
Beds
2
Baths
1,800
Sq Ft
$150/Sq Ft
Est. Value
About This Home
This home is located at 225 Bynum Rd, Lincolnton, NC 28092 and is currently estimated at $270,333, approximately $150 per square foot. 225 Bynum Rd is a home located in Lincoln County with nearby schools including S. Ray Lowder Elementary School, West Lincoln Middle, and West Lincoln High School.
Ownership History
Date
Name
Owned For
Owner Type
Purchase Details
Closed on
Mar 5, 2012
Sold by
Key Properties Of Lincolnton Inc
Bought by
Sweet Terrell R
Current Estimated Value
Home Financials for this Owner
Home Financials are based on the most recent Mortgage that was taken out on this home.
Original Mortgage
$122,448
Outstanding Balance
$84,193
Interest Rate
3.89%
Mortgage Type
New Conventional
Estimated Equity
$186,140
Purchase Details
Closed on
Dec 1, 2011
Sold by
Aurora Loan Services Llc
Bought by
Key Properties Of Lincolnton Inc
Purchase Details
Closed on
Aug 15, 2011
Sold by
Johnson George E and Johnson Melody
Bought by
Aurora Loan Services Llc
Purchase Details
Closed on
Apr 19, 2007
Sold by
Alexander Deborah Jean and Alexander William B
Bought by
Johnson George E
Home Financials for this Owner
Home Financials are based on the most recent Mortgage that was taken out on this home.
Original Mortgage
$156,750
Interest Rate
6.1%
Mortgage Type
New Conventional
Create a Home Valuation Report for This Property
The Home Valuation Report is an in-depth analysis detailing your home's value as well as a comparison with similar homes in the area
Home Values in the Area
Average Home Value in this Area
Purchase History
| Date | Buyer | Sale Price | Title Company |
|---|---|---|---|
| Sweet Terrell R | $120,000 | None Available | |
| Key Properties Of Lincolnton Inc | $80,000 | None Available | |
| Aurora Loan Services Llc | $70,125 | None Available | |
| Johnson George E | $20,000 | None Available |
Source: Public Records
Mortgage History
| Date | Status | Borrower | Loan Amount |
|---|---|---|---|
| Open | Sweet Terrell R | $122,448 | |
| Previous Owner | Johnson George E | $156,750 |
Source: Public Records
Tax History Compared to Growth
Tax History
| Year | Tax Paid | Tax Assessment Tax Assessment Total Assessment is a certain percentage of the fair market value that is determined by local assessors to be the total taxable value of land and additions on the property. | Land | Improvement |
|---|---|---|---|---|
| 2025 | $1,822 | $269,611 | $33,793 | $235,818 |
| 2024 | $1,802 | $269,611 | $33,793 | $235,818 |
| 2023 | $1,797 | $269,611 | $33,793 | $235,818 |
| 2022 | $1,229 | $149,685 | $24,552 | $125,133 |
| 2021 | $1,229 | $149,685 | $24,552 | $125,133 |
| 2020 | $1,084 | $149,685 | $24,552 | $125,133 |
| 2019 | $1,084 | $149,685 | $24,552 | $125,133 |
| 2018 | $1,045 | $128,233 | $22,540 | $105,693 |
| 2017 | $944 | $128,233 | $22,540 | $105,693 |
| 2016 | $944 | $128,233 | $22,540 | $105,693 |
| 2015 | $1,011 | $128,233 | $22,540 | $105,693 |
| 2014 | $1,044 | $139,554 | $23,575 | $115,979 |
Source: Public Records
Map
Nearby Homes
- 170 Whitesides Dr
- 000 Southside Rd
- 2503 Tin Mine Rd
- TBD Southfork Rd
- 155 Golden Aster Dr
- 2319 Tin Mine Rd
- 3347 & 3349 Gastonia Hwy
- 238 Victory Grove Church Rd
- 584 Southside Church Rd
- 2641 Southside Rd
- 2913 & 2901 Wesleyan Church Rd
- 00 Lake Sylvia Rd
- 1218 W Highview Ln
- 2988 Wesleyan Church Rd
- 00 Smith Farm Rd
- 140 Robin Rd
- 110 Robin Rd
- 1233 General Hoke Dr
- 675 Heather Dr
- 755 Victory Grove Church Rd