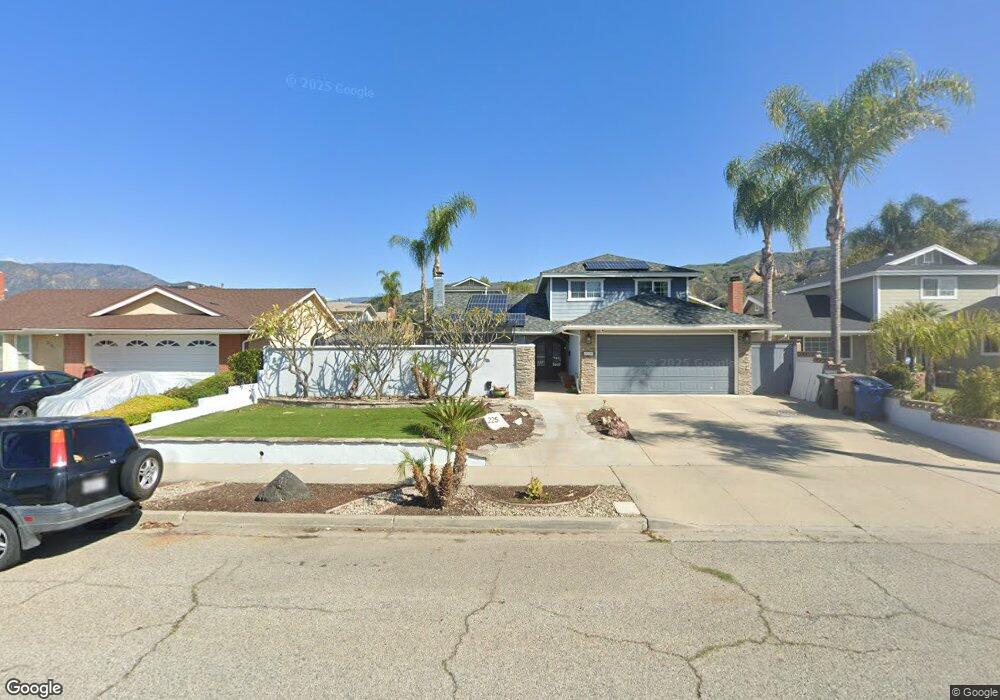
225 Casner Way Fillmore, CA 93015
Estimated Value: $699,303 - $759,000
5
Beds
2
Baths
1,710
Sq Ft
$419/Sq Ft
Est. Value
About This Home
This home is located at 225 Casner Way, Fillmore, CA 93015 and is currently estimated at $717,076, approximately $419 per square foot. 225 Casner Way is a home located in Ventura County with nearby schools including Fillmore Senior High.
Ownership History
Date
Name
Owned For
Owner Type
Purchase Details
Closed on
Sep 2, 2022
Sold by
Gabriel Billy G and Gabriel Maria G
Bought by
Gabriel Family Trust
Current Estimated Value
Purchase Details
Closed on
Sep 14, 1998
Sold by
Hartung John A and Hartung Katherine T
Bought by
Gabriel Billy and Gabriel Maria G
Home Financials for this Owner
Home Financials are based on the most recent Mortgage that was taken out on this home.
Original Mortgage
$162,379
Interest Rate
6.88%
Mortgage Type
FHA
Purchase Details
Closed on
Feb 3, 1994
Sold by
Hartung John A and Hartung Katherine T
Bought by
Hartung John A and Hartung Katherine T
Create a Home Valuation Report for This Property
The Home Valuation Report is an in-depth analysis detailing your home's value as well as a comparison with similar homes in the area
Home Values in the Area
Average Home Value in this Area
Purchase History
| Date | Buyer | Sale Price | Title Company |
|---|---|---|---|
| Gabriel Family Trust | -- | -- | |
| Gabriel Billy | $166,000 | Chicago Title | |
| Hartung John A | -- | -- |
Source: Public Records
Mortgage History
| Date | Status | Borrower | Loan Amount |
|---|---|---|---|
| Previous Owner | Gabriel Billy | $162,379 |
Source: Public Records
Tax History Compared to Growth
Tax History
| Year | Tax Paid | Tax Assessment Tax Assessment Total Assessment is a certain percentage of the fair market value that is determined by local assessors to be the total taxable value of land and additions on the property. | Land | Improvement |
|---|---|---|---|---|
| 2025 | $2,906 | $260,206 | $104,080 | $156,126 |
| 2024 | $2,906 | $255,104 | $102,039 | $153,065 |
| 2023 | $2,866 | $250,102 | $100,038 | $150,064 |
| 2022 | $2,652 | $245,199 | $98,077 | $147,122 |
| 2021 | $3,014 | $240,392 | $96,154 | $144,238 |
| 2020 | $2,797 | $237,929 | $95,169 | $142,760 |
| 2019 | $2,805 | $233,264 | $93,303 | $139,961 |
| 2018 | $2,749 | $228,691 | $91,474 | $137,217 |
| 2017 | $2,765 | $224,208 | $89,681 | $134,527 |
| 2016 | $2,561 | $219,813 | $87,923 | $131,890 |
| 2015 | $2,491 | $216,513 | $86,603 | $129,910 |
| 2014 | $2,489 | $212,273 | $84,907 | $127,366 |
Source: Public Records
Map
Nearby Homes
- 229 Main St
- 638 Clay St
- 0 Fillmore St
- 340 Central Ave
- 412 Blaine Ave
- 196 Elmwood St
- 185 Rosewood St
- 199 Rosewood St
- 74 Teakwood St
- 81 Wildwood Ln
- 396 Edgewood Dr
- 309 Heritage Valley Pkwy
- 915 E Telegraph Rd
- 89 Willow St
- 250 E Telegraph Rd Unit 191
- 250 E Telegraph Rd Unit 197
- 250 E Telegraph Rd Unit 68
- 250 E Telegraph Rd Unit 223
- 250 E Telegraph Rd Unit 77
- 250 E Telegraph Rd Unit 195