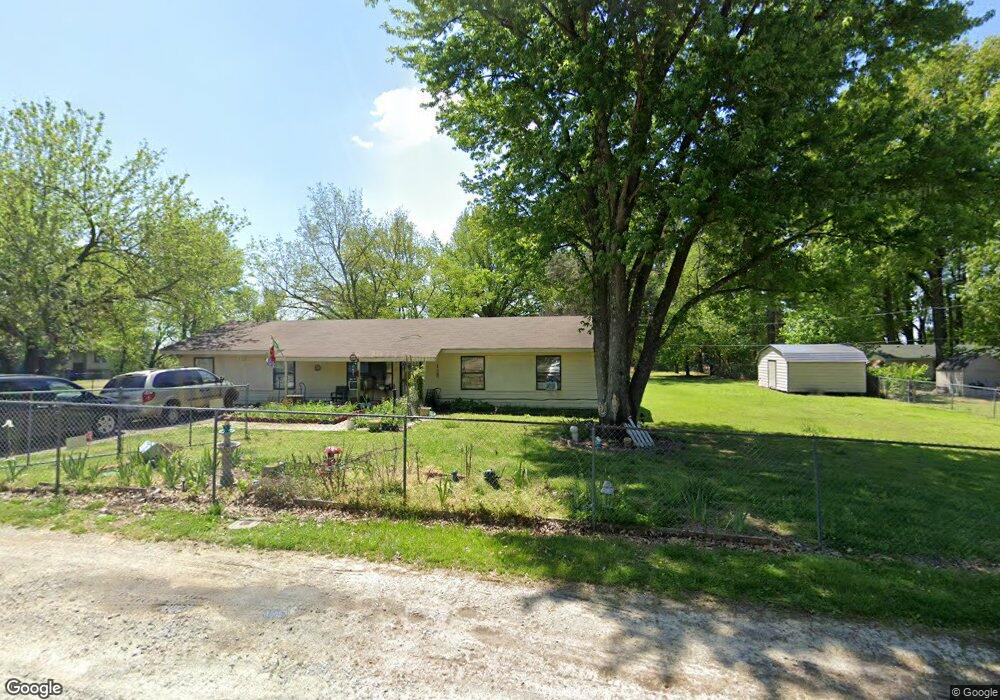
225 Dawn Ln Brighton, TN 38011
Estimated Value: $176,799 - $234,000
Studio
2
Baths
1,612
Sq Ft
$122/Sq Ft
Est. Value
About This Home
This home is located at 225 Dawn Ln, Brighton, TN 38011 and is currently estimated at $195,950, approximately $121 per square foot. 225 Dawn Ln is a home located in Tipton County with nearby schools including Crestview Elementary School, Crestview Middle School, and Covington High School.
Ownership History
Date
Name
Owned For
Owner Type
Purchase Details
Closed on
Sep 13, 2006
Sold by
David Foshee
Bought by
David Foshee
Current Estimated Value
Home Financials for this Owner
Home Financials are based on the most recent Mortgage that was taken out on this home.
Original Mortgage
$70,000
Interest Rate
6.48%
Purchase Details
Closed on
May 7, 1996
Bought by
Fosheee David
Purchase Details
Closed on
Aug 31, 1990
Bought by
Baker Timothy C and Baker Linda K
Purchase Details
Closed on
Jul 14, 1989
Bought by
Culley Jack B and Culley Helen F
Purchase Details
Closed on
Apr 28, 1988
Bought by
Billings Harry A and Billings Patsy C
Purchase Details
Closed on
Feb 21, 1981
Bought by
Harris Wilbur and Harris Timbley K
Purchase Details
Closed on
Aug 16, 1980
Purchase Details
Closed on
Nov 17, 1978
Purchase Details
Closed on
Apr 15, 1977
Create a Home Valuation Report for This Property
The Home Valuation Report is an in-depth analysis detailing your home's value as well as a comparison with similar homes in the area
Purchase History
We collect this data history from publicly available records. To have your information removed, we recommend requesting removal directly through your county’s website.
| Date | Buyer | Sale Price | Title Company |
|---|---|---|---|
| David Foshee | -- | -- | |
| Fosheee David | $65,000 | -- | |
| Baker Timothy C | $53,800 | -- | |
| Culley Jack B | $50,500 | -- | |
| Billings Harry A | $49,900 | -- | |
| Harris Wilbur | -- | -- | |
| -- | -- | -- | |
| -- | -- | -- | |
| -- | -- | -- |
Source: Public Records
Mortgage History
We collect this data history from publicly available records. To have your information removed, we recommend requesting removal directly through your county’s website.
| Date | Status | Borrower | Loan Amount |
|---|---|---|---|
| Closed | Not Available | $70,000 |
Source: Public Records
Tax History
| Year | Tax Paid | Tax Assessment Tax Assessment Total Assessment is a certain percentage of the fair market value that is determined by local assessors to be the total taxable value of land and additions on the property. | Land | Improvement |
|---|---|---|---|---|
| 2025 | $546 | $35,875 | $5,300 | $30,575 |
| 2024 | $546 | $35,875 | $5,300 | $30,575 |
| 2023 | $546 | $35,875 | $5,300 | $30,575 |
| 2022 | $513 | $25,150 | $3,900 | $21,250 |
| 2021 | $513 | $25,150 | $3,900 | $21,250 |
| 2020 | $513 | $25,150 | $3,900 | $21,250 |
| 2019 | $446 | $18,450 | $3,000 | $15,450 |
| 2018 | $446 | $18,450 | $3,000 | $15,450 |
| 2017 | $446 | $18,450 | $3,000 | $15,450 |
| 2016 | $446 | $18,450 | $3,000 | $15,450 |
| 2015 | $444 | $18,375 | $3,000 | $15,375 |
| 2014 | $444 | $18,366 | $0 | $0 |
Source: Public Records
Map
Nearby Homes
- 605 Junior Dr
- 378 Holly Grove Rd
- 1233 Dawson Rd
- 273 Daniel Dr
- 206 Deen Rd
- 409 Daniel Dr
- 2847 Holly Grove Rd
- 375 Mueller Brass Rd
- 100 Holly Grove Rd
- 0 Mueller Brass Rd
- 597 Walton Loop
- 129 Tatlock Cir
- 0 Mount Carmel Rd
- 127 Walton Loop
- 1766 Tennessee 59
- 414 Hyde Park Cir
- 502 James Ave
- 635 Oakview Ave
- 1321 Tennessee 59
- 503 Terrace Dr
Your Personal Tour Guide
Ask me questions while you tour the home.