225 Point Cir Pilot Point, TX 76258
Estimated Value: $262,000 - $295,000
3
Beds
2
Baths
1,378
Sq Ft
$200/Sq Ft
Est. Value
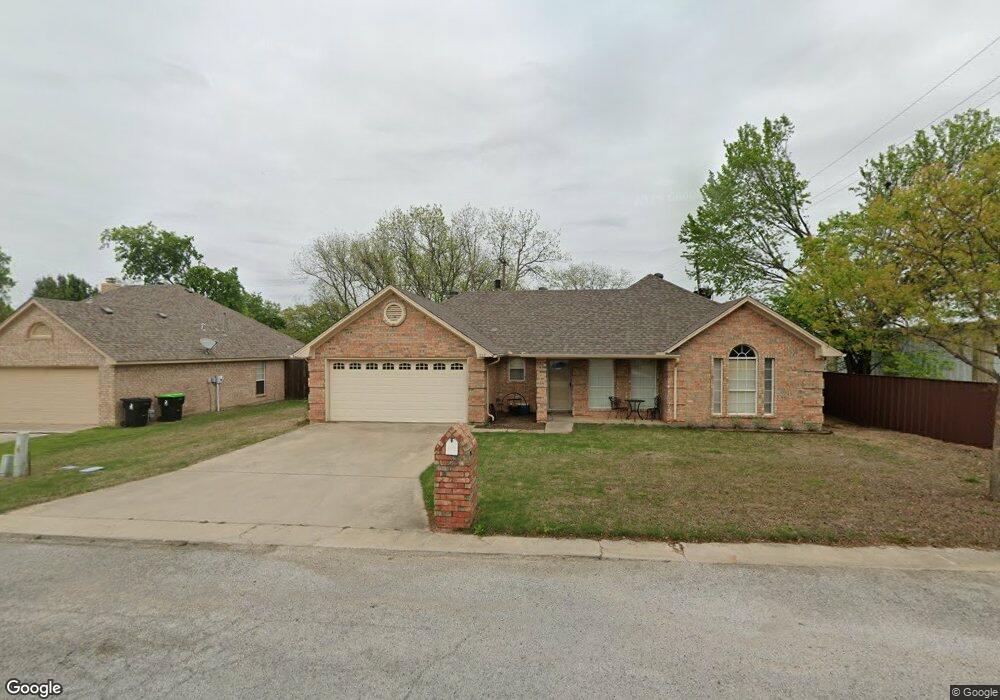
About This Home
This home is located at 225 Point Cir, Pilot Point, TX 76258 and is currently estimated at $275,844, approximately $200 per square foot. 225 Point Cir is a home located in Denton County with nearby schools including Pilot Point Early Childhood Center, Pilot Point Elementary School, and Pilot Point Middle School.
Ownership History
Date
Name
Owned For
Owner Type
Purchase Details
Closed on
Dec 27, 2010
Sold by
Fischer Michael G
Bought by
Fischer Michael G and Fischer Deborah Sue
Current Estimated Value
Home Financials for this Owner
Home Financials are based on the most recent Mortgage that was taken out on this home.
Original Mortgage
$65,000
Interest Rate
4.44%
Mortgage Type
Credit Line Revolving
Purchase Details
Closed on
Aug 4, 2003
Sold by
Hilz W E and Hilz Sue
Bought by
Fischer Michael G and Hilz Deborah
Home Financials for this Owner
Home Financials are based on the most recent Mortgage that was taken out on this home.
Original Mortgage
$95,000
Interest Rate
5.24%
Mortgage Type
Purchase Money Mortgage
Purchase Details
Closed on
Jul 30, 2001
Sold by
Sullivan Danny Lloyd and Sullivan Dawn Marie
Bought by
Dejernett Ernest E and Dejernett Mary Ann
Purchase Details
Closed on
Jul 15, 1998
Sold by
Evans Edgar
Bought by
Hilz W E W and Hilz Sue
Create a Home Valuation Report for This Property
The Home Valuation Report is an in-depth analysis detailing your home's value as well as a comparison with similar homes in the area
Home Values in the Area
Average Home Value in this Area
Purchase History
| Date | Buyer | Sale Price | Title Company |
|---|---|---|---|
| Fischer Michael G | -- | Stnt | |
| Fischer Michael G | -- | Fatco | |
| Dejernett Ernest E | -- | First American Title Co | |
| Hilz W E W | -- | -- |
Source: Public Records
Mortgage History
| Date | Status | Borrower | Loan Amount |
|---|---|---|---|
| Closed | Fischer Michael G | $65,000 | |
| Closed | Fischer Michael G | $95,000 |
Source: Public Records
Tax History Compared to Growth
Tax History
| Year | Tax Paid | Tax Assessment Tax Assessment Total Assessment is a certain percentage of the fair market value that is determined by local assessors to be the total taxable value of land and additions on the property. | Land | Improvement |
|---|---|---|---|---|
| 2025 | $1,272 | $284,807 | $49,748 | $235,059 |
| 2024 | $5,007 | $278,130 | $0 | $0 |
| 2023 | $1,275 | $252,845 | $49,748 | $227,651 |
| 2022 | $2,658 | $229,859 | $40,535 | $195,480 |
| 2021 | $4,312 | $211,665 | $40,535 | $171,130 |
| 2020 | $3,947 | $189,965 | $19,899 | $181,756 |
| 2019 | $3,700 | $172,696 | $19,899 | $182,726 |
| 2018 | $3,406 | $156,996 | $18,057 | $156,502 |
| 2017 | $3,105 | $142,724 | $16,951 | $137,985 |
| 2016 | $2,823 | $129,749 | $16,583 | $125,678 |
| 2015 | $2,264 | $117,954 | $16,583 | $101,371 |
| 2014 | $2,264 | $107,996 | $18,425 | $89,571 |
| 2013 | -- | $100,966 | $18,425 | $82,541 |
Source: Public Records
Map
Nearby Homes
- 100 S Levy St
- 724 E Main St
- 517 S Kirby St
- 504 S Kirby St
- 515 E Liberty St
- 511 S Irick St
- 510 S Irick St
- 419 E Main St
- 145 Cole Ln
- 408 E Liberty St
- 400 E Liberty St
- 836 Debbie Ln
- 308 S Sherman St
- 720 Carson Ln
- 317 E Liberty St
- 700 Carson Ln
- Caspian Plan at Yarbrough Farms
- Blazer Plan at Yarbrough Farms
- Addison Plan at Yarbrough Farms
- Appaloosa Plan at Yarbrough Farms
- 217 Point Cir
- 216 Point Cir
- 209 Point Cir
- 229 Point Cir
- 208 Point Cir
- 717 E Liberty St Unit 300
- 717 E Liberty St Unit 200
- 717 E Liberty St
- 201 Point Cir
- 237 Point Cir
- 400 Roberts Ct
- 701 E Liberty St
- 236 Point Cir
- 635 E Liberty St
- 244 Point Cir
- 408 Roberts Ct
- 315 Nazarene Ct
- 627 E Liberty St
- 708 E Liberty St
- 716 E Liberty St