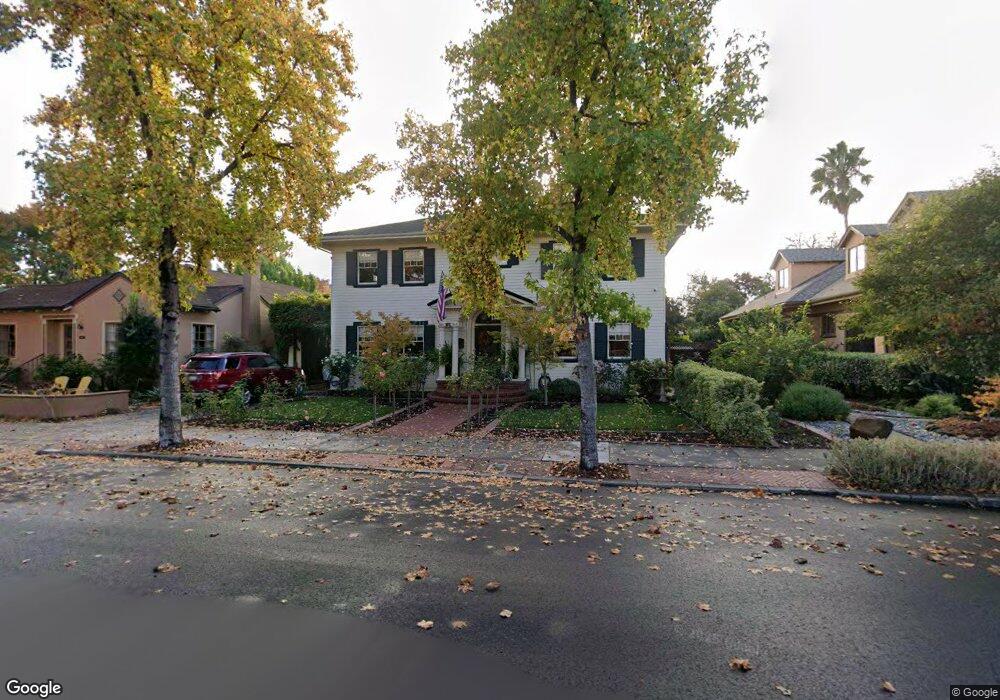
225 S 13th St San Jose, CA 95112
Naglee Park NeighborhoodEstimated Value: $1,504,994 - $1,613,000
3
Beds
1
Bath
2,464
Sq Ft
$626/Sq Ft
Est. Value
About This Home
This home is located at 225 S 13th St, San Jose, CA 95112 and is currently estimated at $1,542,749, approximately $626 per square foot. 225 S 13th St is a home located in Santa Clara County with nearby schools including Horace Mann Elementary School, Muwekma Ohlone Middle, and San Jose High School.
Ownership History
Date
Name
Owned For
Owner Type
Purchase Details
Closed on
Apr 14, 2021
Sold by
Evans Richard Ernest and Evans Cris Elaine
Bought by
Evans Richard E and Evans Cris E
Current Estimated Value
Home Financials for this Owner
Home Financials are based on the most recent Mortgage that was taken out on this home.
Original Mortgage
$275,000
Interest Rate
3.05%
Mortgage Type
New Conventional
Purchase Details
Closed on
Dec 16, 2015
Sold by
Evans Richard E and Evans Cris E
Bought by
Evans Family Trust and Evans Cris E
Purchase Details
Closed on
Nov 1, 2001
Sold by
Evans Richard E
Bought by
Evans Richard E and Evans Cris
Home Financials for this Owner
Home Financials are based on the most recent Mortgage that was taken out on this home.
Original Mortgage
$150,000
Interest Rate
6.62%
Create a Home Valuation Report for This Property
The Home Valuation Report is an in-depth analysis detailing your home's value as well as a comparison with similar homes in the area
Home Values in the Area
Average Home Value in this Area
Purchase History
| Date | Buyer | Sale Price | Title Company |
|---|---|---|---|
| Evans Richard E | -- | Fidelity National Title Co | |
| Evans Richard Ernest | -- | Fidelity National Title Co | |
| Evans Family Trust | -- | None Available | |
| Evans Richard E | -- | None Available | |
| Evans Richard E | -- | American Title Co |
Source: Public Records
Mortgage History
| Date | Status | Borrower | Loan Amount |
|---|---|---|---|
| Closed | Evans Richard Ernest | $275,000 | |
| Closed | Evans Richard E | $150,000 |
Source: Public Records
Tax History Compared to Growth
Tax History
| Year | Tax Paid | Tax Assessment Tax Assessment Total Assessment is a certain percentage of the fair market value that is determined by local assessors to be the total taxable value of land and additions on the property. | Land | Improvement |
|---|---|---|---|---|
| 2025 | $3,063 | $81,186 | $26,302 | $54,884 |
| 2024 | $3,063 | $79,595 | $25,787 | $53,808 |
| 2023 | $2,948 | $78,035 | $25,282 | $52,753 |
| 2022 | $2,903 | $76,506 | $24,787 | $51,719 |
| 2021 | $2,751 | $75,006 | $24,301 | $50,705 |
| 2020 | $2,572 | $74,238 | $24,052 | $50,186 |
| 2019 | $2,461 | $72,783 | $23,581 | $49,202 |
| 2018 | $1,985 | $71,357 | $23,119 | $48,238 |
| 2017 | $1,952 | $69,959 | $22,666 | $47,293 |
| 2016 | $1,818 | $68,588 | $22,222 | $46,366 |
| 2015 | $1,788 | $67,559 | $21,889 | $45,670 |
| 2014 | $1,375 | $66,237 | $21,461 | $44,776 |
Source: Public Records
Map
Nearby Homes
- 188 S 14th St
- 339 S 13th St
- 101 S 13th St
- 551 S 15th St
- 384 S 11th St
- 415 S 14th St
- 850 Calhoun St
- 371 E William St
- 360 E William St
- 396 S 18th St
- 631 S 14th St
- 614 S 12th St
- 431 E Saint John St
- 84 S 5th St
- 680 S 12th St
- 18 S 21st St Unit 200
- 987 E William St
- 197 N 9th St
- 696 Margaret St
- 92 N 6th St