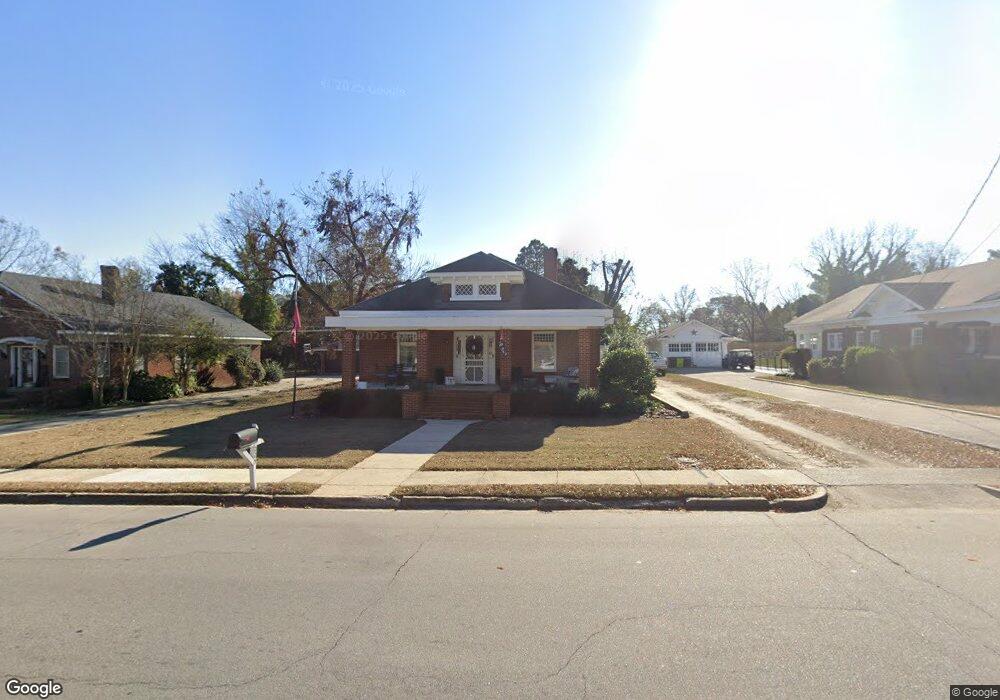
225 W Third St Wendell, NC 27591
Estimated Value: $290,000 - $345,000
Studio
1
Bath
1,666
Sq Ft
$197/Sq Ft
Est. Value
About This Home
This home is located at 225 W Third St, Wendell, NC 27591 and is currently estimated at $328,935, approximately $197 per square foot. 225 W Third St is a home located in Wake County with nearby schools including Wendell Elementary, Wendell Middle School, and East Wake High School.
Ownership History
Date
Name
Owned For
Owner Type
Purchase Details
Closed on
Sep 14, 2022
Sold by
Dean Ryan C and Bridgers Morgan
Bought by
Deloach Joseph Brantley and Deloach Valerie V
Current Estimated Value
Home Financials for this Owner
Home Financials are based on the most recent Mortgage that was taken out on this home.
Original Mortgage
$280,000
Outstanding Balance
$266,940
Interest Rate
4.99%
Mortgage Type
New Conventional
Estimated Equity
$61,995
Purchase Details
Closed on
Mar 28, 2022
Sold by
Elizabeth Bridgers Morgan
Bought by
Bridgers Morgan Elizabeth and Bridgers Ryan Chistopher
Home Financials for this Owner
Home Financials are based on the most recent Mortgage that was taken out on this home.
Original Mortgage
$132,000
Interest Rate
4.42%
Mortgage Type
Balloon
Purchase Details
Closed on
Apr 25, 2020
Sold by
Bridgers Shelton V and Bridgers Rebecca N
Bought by
Bridgers Morgan Elizabeth
Purchase Details
Closed on
Aug 15, 2019
Sold by
Bridgers Shelton V and Bridgers Rebecca N
Bought by
Bridgers Morgan Elizabeth
Create a Home Valuation Report for This Property
The Home Valuation Report is an in-depth analysis detailing your home's value as well as a comparison with similar homes in the area
Home Values in the Area
Average Home Value in this Area
Purchase History
| Date | Buyer | Sale Price | Title Company |
|---|---|---|---|
| Deloach Joseph Brantley | $350,000 | -- | |
| Bridgers Morgan Elizabeth | -- | None Listed On Document | |
| Bridgers Morgan Elizabeth | -- | None Available | |
| Bridgers Morgan Elizabeth | -- | None Available |
Source: Public Records
Mortgage History
| Date | Status | Borrower | Loan Amount |
|---|---|---|---|
| Open | Deloach Joseph Brantley | $280,000 | |
| Previous Owner | Bridgers Morgan Elizabeth | $132,000 |
Source: Public Records
Tax History
| Year | Tax Paid | Tax Assessment Tax Assessment Total Assessment is a certain percentage of the fair market value that is determined by local assessors to be the total taxable value of land and additions on the property. | Land | Improvement |
|---|---|---|---|---|
| 2025 | $3,108 | $284,306 | $80,000 | $204,306 |
| 2024 | $3,055 | $284,306 | $80,000 | $204,306 |
Source: Public Records
Map
Nearby Homes
- 316 Wendell Falls Pkwy
- 1220 Pavo Path
- 560 Stream Walk Crossing
- 600 Stream Walk Crossing
- 545 Stream Walk Crossing
- 111 Merle Dr
- 551 Stream Walk Crossing
- 553 Stream Walk Crossing
- 543 Stream Walk Crossing
- 549 Stream Walk Crossing
- 1217 Pavo Path
- 559 Stream Walk Crossing
- 547 Stream Walk Crossing
- 134 Merle Dr
- 18 N Main St
- 217 N Magnolia St
- 142 W Haywood St
- 2428 Rosslare Mews Ln
- 23 W Academy St
- 401 Oak Dare Ln
Your Personal Tour Guide
Ask me questions while you tour the home.