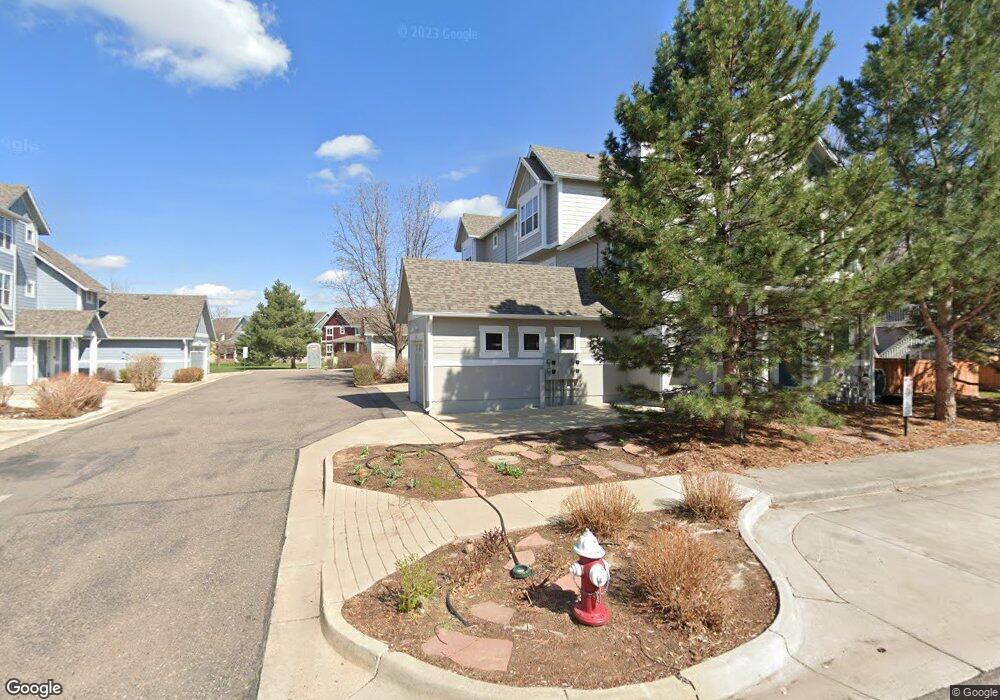
2250 Watersong Cir Longmont, CO 80504
Pike NeighborhoodEstimated Value: $475,000 - $508,000
2
Beds
3
Baths
1,231
Sq Ft
$402/Sq Ft
Est. Value
About This Home
This home is located at 2250 Watersong Cir, Longmont, CO 80504 and is currently estimated at $495,425, approximately $402 per square foot. 2250 Watersong Cir is a home located in Boulder County with nearby schools including Indian Peaks Elementary School, Sunset Middle School, and Niwot High School.
Ownership History
Date
Name
Owned For
Owner Type
Purchase Details
Closed on
Feb 4, 2022
Sold by
Sparks Gregory E
Bought by
2250 Watersong Llc
Current Estimated Value
Purchase Details
Closed on
Jan 22, 2015
Sold by
Syph George Lester Spyher and Syph Mary Beth
Bought by
Sparks Gregory E
Home Financials for this Owner
Home Financials are based on the most recent Mortgage that was taken out on this home.
Original Mortgage
$189,000
Interest Rate
3.97%
Mortgage Type
New Conventional
Purchase Details
Closed on
Nov 1, 2010
Sold by
Sypher George Lester and Sypher Mary Beth
Bought by
Syph George Lester Sypher and Syph Mary Beth
Purchase Details
Closed on
Jul 26, 2002
Sold by
Watersong Townhomes Llc
Bought by
Sypher George Lester
Home Financials for this Owner
Home Financials are based on the most recent Mortgage that was taken out on this home.
Original Mortgage
$190,800
Interest Rate
6.69%
Create a Home Valuation Report for This Property
The Home Valuation Report is an in-depth analysis detailing your home's value as well as a comparison with similar homes in the area
Home Values in the Area
Average Home Value in this Area
Purchase History
| Date | Buyer | Sale Price | Title Company |
|---|---|---|---|
| 2250 Watersong Llc | -- | None Listed On Document | |
| Sparks Gregory E | $252,000 | Heritage Title | |
| Syph George Lester Sypher | -- | None Available | |
| Sypher George Lester | $212,000 | Land Title Guarantee Company |
Source: Public Records
Mortgage History
| Date | Status | Borrower | Loan Amount |
|---|---|---|---|
| Previous Owner | Sparks Gregory E | $189,000 | |
| Previous Owner | Sypher George Lester | $190,800 |
Source: Public Records
Tax History Compared to Growth
Tax History
| Year | Tax Paid | Tax Assessment Tax Assessment Total Assessment is a certain percentage of the fair market value that is determined by local assessors to be the total taxable value of land and additions on the property. | Land | Improvement |
|---|---|---|---|---|
| 2025 | $3,136 | $33,569 | $5,856 | $27,713 |
| 2024 | $3,136 | $33,569 | $5,856 | $27,713 |
| 2023 | $3,093 | $32,783 | $6,204 | $30,264 |
| 2022 | $2,579 | $26,062 | $4,719 | $21,343 |
| 2021 | $2,613 | $26,813 | $4,855 | $21,958 |
| 2020 | $2,403 | $24,739 | $4,719 | $20,020 |
| 2019 | $2,365 | $24,739 | $4,719 | $20,020 |
| 2018 | $2,031 | $21,384 | $3,895 | $17,489 |
| 2017 | $2,004 | $24,230 | $4,298 | $19,932 |
| 2016 | $1,879 | $19,662 | $6,050 | $13,612 |
| 2015 | $1,791 | $17,305 | $4,219 | $13,086 |
| 2014 | $1,616 | $17,305 | $4,219 | $13,086 |
Source: Public Records
Map
Nearby Homes
- 2425 Water Cress Ct
- 2111 River Walk Ln
- 2215 Parkview Dr
- 2020 Creekside Dr
- 2284 Indian Peaks Cir
- 2240 Summitview Dr
- 2062 Ridgeview Dr
- 1822 Redtop Ct
- 1313 Carnation Cir
- 1327 Brookfield Dr
- 1906 Wildrose Dr
- 1801 S Pratt Pkwy
- 1028 Katy Ln
- 3617 Sunflower Cir
- 1518 Sepia Ave
- 8584 Summerlin Place
- 919 S Sherman St
- 905 Tempted Ways Dr
- 903 Tempted Ways Dr
- 901 Tempted Ways Dr
- 2250 Watersong Cir
- 2252 Watersong Cir
- 2252 Watersong Cir
- 2302 Watersong Cir
- 2254 Watersong Cir
- 2280 Watersong Cir
- 2278 Watersong Cir
- 2248 Watersong Cir
- 2276 Watersong Cir
- 2246 Watersong Cir
- 2306 Watersong Cir
- 2244 Watersong Cir
- 2244 Watersong Cir
- 2274 Watersong Cir
- 2242 Watersong Cir
- 2310 Watersong Cir
- 2257 Watersong Cir
- 2314 Watersong Cir
- 2220 Watersong Cir
- 2220 Watersong Cir