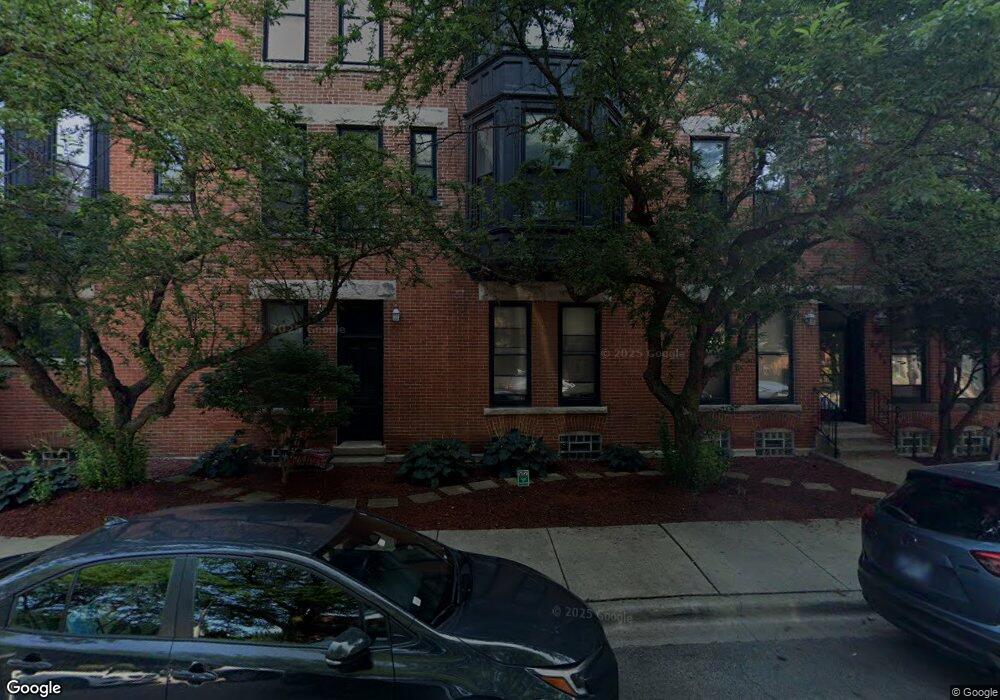
2251 N Clifton Ave Unit 22513N Chicago, IL 60614
Sheffield & DePaul NeighborhoodEstimated Value: $339,000 - $469,491
--
Bed
--
Bath
1,400
Sq Ft
$293/Sq Ft
Est. Value
About This Home
This home is located at 2251 N Clifton Ave Unit 22513N, Chicago, IL 60614 and is currently estimated at $410,123, approximately $292 per square foot. 2251 N Clifton Ave Unit 22513N is a home located in Cook County with nearby schools including Mayer Elementary School, Lincoln Park High School, and St Josaphat School.
Ownership History
Date
Name
Owned For
Owner Type
Purchase Details
Closed on
Jun 26, 2001
Sold by
Bransfield John P
Bought by
Bransfield John P
Current Estimated Value
Home Financials for this Owner
Home Financials are based on the most recent Mortgage that was taken out on this home.
Original Mortgage
$200,000
Interest Rate
7.2%
Mortgage Type
Balloon
Purchase Details
Closed on
Jan 15, 1999
Sold by
Fine Robin S
Bought by
Bransfield John P and John P Bransfield Trust
Home Financials for this Owner
Home Financials are based on the most recent Mortgage that was taken out on this home.
Original Mortgage
$178,200
Interest Rate
7.37%
Purchase Details
Closed on
Oct 13, 1995
Sold by
Lasalle National Trust Na
Bought by
Fire Robin S
Home Financials for this Owner
Home Financials are based on the most recent Mortgage that was taken out on this home.
Original Mortgage
$140,600
Interest Rate
7.25%
Create a Home Valuation Report for This Property
The Home Valuation Report is an in-depth analysis detailing your home's value as well as a comparison with similar homes in the area
Home Values in the Area
Average Home Value in this Area
Purchase History
| Date | Buyer | Sale Price | Title Company |
|---|---|---|---|
| Bransfield John P | -- | -- | |
| Bransfield John P | $198,000 | -- | |
| Fire Robin S | $148,000 | -- |
Source: Public Records
Mortgage History
| Date | Status | Borrower | Loan Amount |
|---|---|---|---|
| Closed | Bransfield John P | $200,000 | |
| Closed | Bransfield John P | $178,200 | |
| Previous Owner | Fire Robin S | $140,600 |
Source: Public Records
Tax History Compared to Growth
Tax History
| Year | Tax Paid | Tax Assessment Tax Assessment Total Assessment is a certain percentage of the fair market value that is determined by local assessors to be the total taxable value of land and additions on the property. | Land | Improvement |
|---|---|---|---|---|
| 2024 | $5,702 | $29,651 | $4,458 | $25,193 |
| 2023 | $5,537 | $30,342 | $3,595 | $26,747 |
| 2022 | $5,537 | $30,342 | $3,595 | $26,747 |
| 2021 | $5,432 | $30,341 | $3,594 | $26,747 |
| 2020 | $4,669 | $24,059 | $3,163 | $20,896 |
| 2019 | $4,561 | $26,130 | $3,163 | $22,967 |
| 2018 | $4,483 | $26,130 | $3,163 | $22,967 |
| 2017 | $2,984 | $17,238 | $2,588 | $14,650 |
| 2016 | $2,952 | $17,238 | $2,588 | $14,650 |
| 2015 | $2,678 | $17,238 | $2,588 | $14,650 |
| 2014 | $2,974 | $18,600 | $1,941 | $16,659 |
| 2013 | $2,905 | $18,600 | $1,941 | $16,659 |
Source: Public Records
Map
Nearby Homes
- 2209 N Seminary Ave
- 2127 N Racine Ave Unit 2
- 2116 N Seminary Ave Unit 28
- 2103 N Clifton Ave
- 2100 N Racine Ave Unit 4B
- 1323 W Belden Ave Unit E1
- 2118 N Sheffield Ave Unit 2
- 2446 N Racine Ave Unit 1F
- 1014 W Montana St
- 2459 N Seminary Ave Unit 2S
- 2124 N Lakewood Ave
- 1242 W Dickens Ave
- 2435 N Sheffield Ave Unit A11
- 907 W Webster Ave
- 2026 N Kenmore Ave
- 1359 W Fullerton Ave Unit PH
- 2144 N Fremont St
- 908 W Fullerton Ave Unit 1
- 908 W Fullerton Ave Unit PH
- 908 W Fullerton Ave Unit 2
- 2251 N Clifton Ave Unit 22511S
- 2251 N Clifton Ave
- 2251 N Clifton Ave Unit 22511N
- 2251 N Clifton Ave Unit 22514S
- 2251 N Clifton Ave Unit 22513S
- 1125 W Belden Ave Unit 11254
- 1125 W Belden Ave Unit 11253
- 2251 N Clifton Ave Unit 22514N
- 2251 N Clifton Ave Unit 22512S
- 1125 W Belden Ave Unit 11251
- 1125 W Belden Ave Unit 11252
- 2251 N Clifton Ave Unit 4N
- 2251 N Clifton Ave Unit 3S
- 1125 W Belden Ave Unit 2
- 2251 N Clifton Ave Unit 2N
- 2251 N Clifton Ave Unit 1N
- 2251 N Clifton Ave Unit 1S
- 1125 W Belden Ave Unit 4
- 1121 W Belden Ave
- 1119 W Belden Ave Unit 2