Estimated Value: $891,000 - $928,000
5
Beds
4
Baths
4,284
Sq Ft
$212/Sq Ft
Est. Value
About This Home
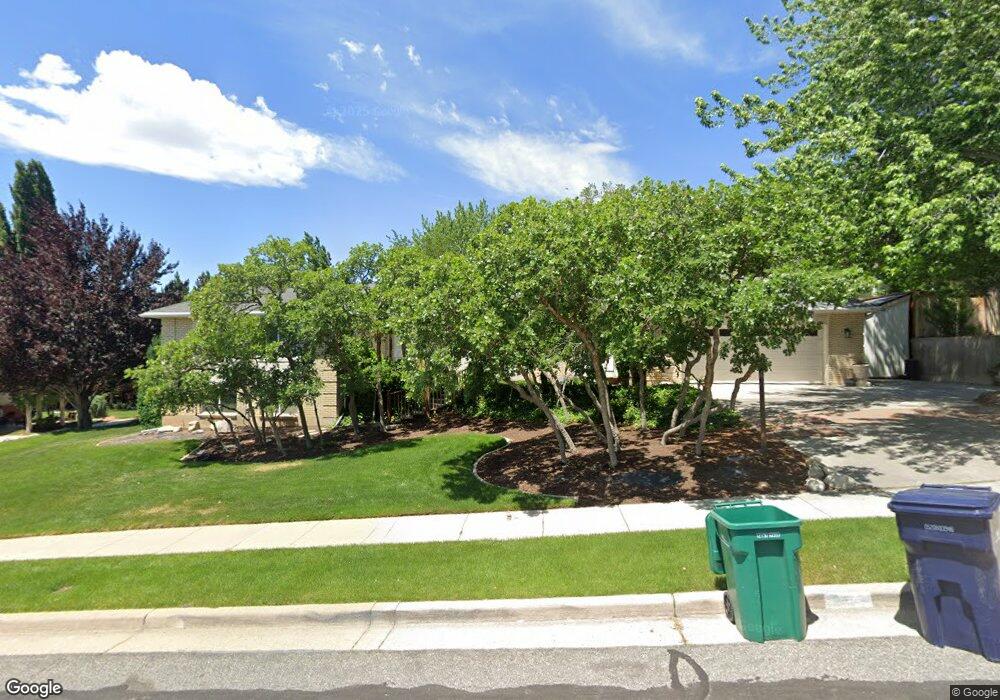
This home is located at 2253 E 11660 S, Sandy, UT 84092 and is currently estimated at $906,513, approximately $211 per square foot. 2253 E 11660 S is a home located in Salt Lake County with nearby schools including Bell Canyon Montessori School and Challenger School - Sandy.
Ownership History
Date
Name
Owned For
Owner Type
Purchase Details
Closed on
Jul 15, 2021
Sold by
Arthur Debenham Shirle
Bought by
Shirle Arthur And Lila Mae Debenham Legacy Tr and Deb Lila
Current Estimated Value
Home Financials for this Owner
Home Financials are based on the most recent Mortgage that was taken out on this home.
Original Mortgage
$450,000
Outstanding Balance
$404,747
Interest Rate
2.9%
Mortgage Type
New Conventional
Estimated Equity
$501,766
Purchase Details
Closed on
Jul 13, 2021
Sold by
Debenham Lila Mae and Debenham Shirle Arthur
Bought by
Debenham James H and Debenham Jennifer M
Home Financials for this Owner
Home Financials are based on the most recent Mortgage that was taken out on this home.
Original Mortgage
$450,000
Outstanding Balance
$404,747
Interest Rate
2.9%
Mortgage Type
New Conventional
Estimated Equity
$501,766
Purchase Details
Closed on
Nov 14, 2012
Sold by
Debenham Shirle A and Debenham Lila M
Bought by
Debenham Shirle Arthur and Debenham Lila Mae
Purchase Details
Closed on
Mar 31, 1998
Sold by
Tycksen Brent A and Tycksen Mar Vele S
Bought by
Debenham Shirle A and Debenham Lila M
Home Financials for this Owner
Home Financials are based on the most recent Mortgage that was taken out on this home.
Original Mortgage
$150,000
Interest Rate
7%
Create a Home Valuation Report for This Property
The Home Valuation Report is an in-depth analysis detailing your home's value as well as a comparison with similar homes in the area
Home Values in the Area
Average Home Value in this Area
Purchase History
| Date | Buyer | Sale Price | Title Company |
|---|---|---|---|
| Shirle Arthur And Lila Mae Debenham Legacy Tr | -- | -- | |
| Debenham James H | -- | Vanguard Title Ins Agcy | |
| Debenham Shirle Arthur | -- | None Available | |
| Debenham Shirle A | -- | -- |
Source: Public Records
Mortgage History
| Date | Status | Borrower | Loan Amount |
|---|---|---|---|
| Open | Debenham James H | $450,000 | |
| Previous Owner | Debenham Shirle A | $150,000 |
Source: Public Records
Tax History
| Year | Tax Paid | Tax Assessment Tax Assessment Total Assessment is a certain percentage of the fair market value that is determined by local assessors to be the total taxable value of land and additions on the property. | Land | Improvement |
|---|---|---|---|---|
| 2025 | $4,172 | $817,000 | $283,800 | $533,200 |
| 2024 | $4,172 | $788,800 | $273,200 | $515,600 |
| 2023 | $3,883 | $733,500 | $262,700 | $470,800 |
| 2022 | $3,934 | $726,600 | $257,500 | $469,100 |
| 2021 | $3,348 | $526,600 | $184,200 | $342,400 |
| 2020 | $3,287 | $488,200 | $184,200 | $304,000 |
| 2019 | $3,289 | $476,800 | $173,800 | $303,000 |
| 2018 | $2,771 | $420,100 | $173,800 | $246,300 |
| 2017 | $2,684 | $389,400 | $173,800 | $215,600 |
| 2016 | $2,700 | $379,100 | $156,600 | $222,500 |
| 2015 | -- | $317,600 | $161,300 | $156,300 |
| 2014 | $2,426 | $310,200 | $161,300 | $148,900 |
Source: Public Records
Map
Nearby Homes
- 2232 E Lone Eagle Ln
- 2192 E High Mesa Dr
- 2250 High Mountain Dr
- 11446 S 2320 E
- 2234 E Willow Brook Way
- 2373 E Bear Hills Cir
- 35 E Lone Hollow Dr
- 12056 S Cortina Crest Dr
- 18 Snow Forest Ln
- 11551 S Woodhampton Dr
- 11129 S 2125 E
- 1 Cross Hill Ln
- 3 Snow Forest Cove Unit 1039
- 7 Rollingwood Ln
- 11382 S Canyon Falls Ln
- 11318 Canyon Falls Ln
- 1 Quietwood Ln
- 16 Gatehouse Ln
- 5 Quietwood Ln
- 9 Windsong
- 2256 E 11620 S
- 2265 E 11660 S
- 2241 E 11660 S
- 2268 E 11620 S
- 2254 E 11660 S
- 2242 E 11660 S
- 2266 E 11660 S
- 11647 S 2220 E
- 2279 E 11660 S
- 2232 E 11620 S
- 2280 E 11620 S
- 2255 E 11620 S
- 2255 Wasatch Blvd
- 11673 S 2220 E
- 2267 E 11620 S
- 2243 E 11620 S
- 2243 Wasatch Blvd
- 2243 E Wasatch Blvd
- 2267 E Wasatch Blvd
- 2267 Wasatch Blvd
Your Personal Tour Guide
Ask me questions while you tour the home.