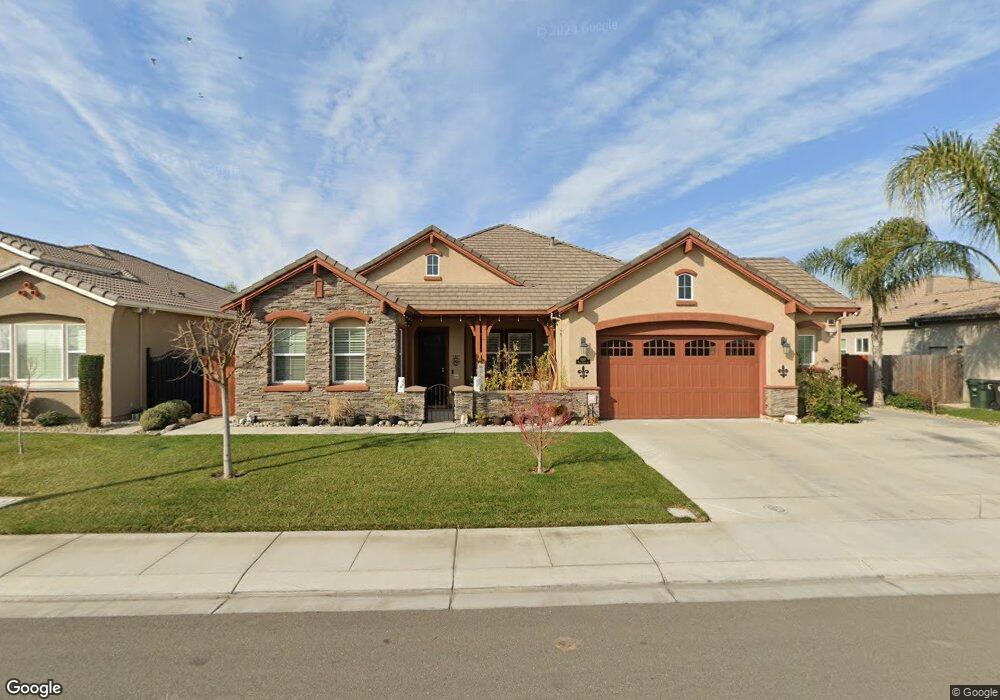
2253 Happy Valley Ln Manteca, CA 95336
Estimated Value: $687,408 - $734,000
4
Beds
3
Baths
2,334
Sq Ft
$303/Sq Ft
Est. Value
About This Home
This home is located at 2253 Happy Valley Ln, Manteca, CA 95336 and is currently estimated at $707,102, approximately $302 per square foot. 2253 Happy Valley Ln is a home with nearby schools including New Haven Elementary School, East Union High School, and BE.TECH Charter High School.
Ownership History
Date
Name
Owned For
Owner Type
Purchase Details
Closed on
Jun 7, 2017
Sold by
Kistler Michael J and Tran Loanne T
Bought by
Kistler Michael J and Tran Loanne
Current Estimated Value
Purchase Details
Closed on
May 20, 2016
Sold by
Tran Loanne T and Tran Loanne
Bought by
Tran Loanne T and Kistler Michael J
Home Financials for this Owner
Home Financials are based on the most recent Mortgage that was taken out on this home.
Original Mortgage
$350,000
Outstanding Balance
$154,634
Interest Rate
3.58%
Mortgage Type
New Conventional
Estimated Equity
$552,468
Purchase Details
Closed on
Sep 10, 2014
Sold by
Union Ranch Partners Llc
Bought by
Tran Loanne
Home Financials for this Owner
Home Financials are based on the most recent Mortgage that was taken out on this home.
Original Mortgage
$219,425
Interest Rate
4.09%
Mortgage Type
New Conventional
Create a Home Valuation Report for This Property
The Home Valuation Report is an in-depth analysis detailing your home's value as well as a comparison with similar homes in the area
Home Values in the Area
Average Home Value in this Area
Purchase History
| Date | Buyer | Sale Price | Title Company |
|---|---|---|---|
| Kistler Michael J | -- | None Available | |
| Tran Loanne T | -- | None Available | |
| Tran Loanne | $439,000 | Placer Title Company |
Source: Public Records
Mortgage History
| Date | Status | Borrower | Loan Amount |
|---|---|---|---|
| Open | Tran Loanne T | $350,000 | |
| Closed | Tran Loanne | $219,425 |
Source: Public Records
Tax History Compared to Growth
Tax History
| Year | Tax Paid | Tax Assessment Tax Assessment Total Assessment is a certain percentage of the fair market value that is determined by local assessors to be the total taxable value of land and additions on the property. | Land | Improvement |
|---|---|---|---|---|
| 2025 | $7,396 | $527,424 | $156,237 | $371,187 |
| 2024 | $7,231 | $517,083 | $153,174 | $363,909 |
| 2023 | $7,162 | $506,945 | $150,171 | $356,774 |
| 2022 | $6,960 | $497,006 | $147,227 | $349,779 |
| 2021 | $6,890 | $487,262 | $144,341 | $342,921 |
| 2020 | $6,661 | $482,266 | $142,861 | $339,405 |
| 2019 | $6,572 | $472,810 | $140,060 | $332,750 |
| 2018 | $6,457 | $463,540 | $137,314 | $326,226 |
| 2017 | $6,438 | $454,452 | $134,622 | $319,830 |
| 2016 | $6,347 | $445,543 | $131,983 | $313,560 |
| 2015 | $6,309 | $438,850 | $130,000 | $308,850 |
| 2014 | $2,325 | $80,000 | $80,000 | $0 |
Source: Public Records
Map
Nearby Homes
- 889 Harvest Mill Dr
- 2418 Finchwood Landing Ln
- 2016 Westboro Ln
- 1072 Glen Abbey Dr
- 2254 Maple Hollow Ln
- 2021 Holbrook Place
- 2253 Maple Hollow Ln
- 6288 E Lathrop Rd
- 1040 Birch Run Way
- 1870 Pecanwood Ave
- 2558 Edgebrook Ln
- 11097 S Union Rd
- 1624 S Highway 99 Unit 19
- 2367 Bellchase Dr
- 447 Ericwood Ct
- 439 Ericwood Ct
- 1660 Kingwood Ave
- 1340 Crimson Place
- 2345 Pepper Tree Ln
- 5958 E Lathrop Rd
- 2265 Happy Valley Ln
- 2241 Happy Valley Ln
- 2230 Rockingham Place
- 2279 Happy Valley Ln
- 2252 Rockingham Place
- 731 Harvest Mill Dr
- 719 Harvest Mill Dr
- 2233 Rockingham Place
- 2291 Happy Valley Ln
- 743 Harvest Mill Dr
- 2274 Rockingham Place
- 755 Harvest Mill Dr
- 2255 Rockingham Place
- 2317 Happy Valley Ln
- 767 Harvest Mill Dr
- 2277 Rockingham Place
- 720 Harvest Mill Dr
- 862 Golden Pond Dr
- 732 Harvest Mill Dr
- 712 Harvest Mill Dr