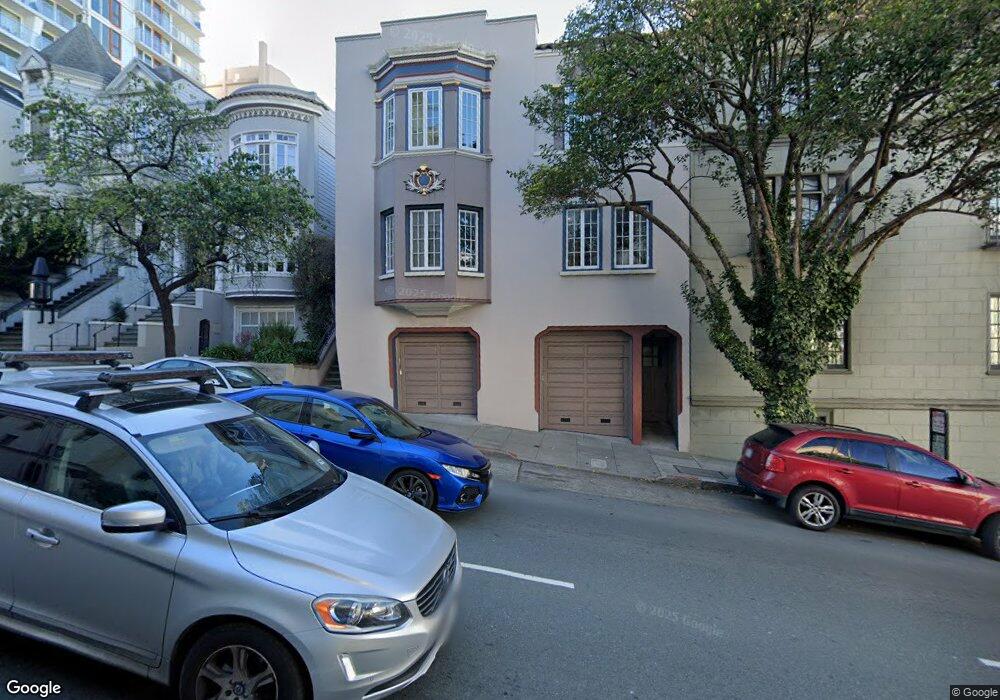
2255 Franklin St San Francisco, CA 94109
Pacific Heights NeighborhoodEstimated Value: $2,455,000 - $3,249,000
3
Beds
3
Baths
2,564
Sq Ft
$1,076/Sq Ft
Est. Value
About This Home
This home is located at 2255 Franklin St, San Francisco, CA 94109 and is currently estimated at $2,758,561, approximately $1,075 per square foot. 2255 Franklin St is a home located in San Francisco County with nearby schools including Sherman Elementary, Marina Middle School, and Mary L. Booker Leadership Academy.
Ownership History
Date
Name
Owned For
Owner Type
Purchase Details
Closed on
Feb 11, 2020
Sold by
Evans Mary B and Gary And Mary Evans Living Tru
Bought by
Tan George Bhuriwat and Boyce Erin Frazer
Current Estimated Value
Home Financials for this Owner
Home Financials are based on the most recent Mortgage that was taken out on this home.
Original Mortgage
$2,120,800
Outstanding Balance
$1,836,288
Interest Rate
2.5%
Mortgage Type
New Conventional
Estimated Equity
$922,273
Purchase Details
Closed on
Mar 10, 2010
Sold by
Vrolyk Anne K
Bought by
Evans Mary B
Purchase Details
Closed on
May 4, 2007
Sold by
Vrolyk Anne K and Vrolyk Anne
Bought by
Vrolyk Anne K
Home Financials for this Owner
Home Financials are based on the most recent Mortgage that was taken out on this home.
Original Mortgage
$1,100,000
Interest Rate
6.14%
Mortgage Type
New Conventional
Purchase Details
Closed on
Aug 23, 2001
Sold by
Vrolyk Anne K
Bought by
Vrolyk Anne
Home Financials for this Owner
Home Financials are based on the most recent Mortgage that was taken out on this home.
Original Mortgage
$200,000
Interest Rate
7.09%
Mortgage Type
Credit Line Revolving
Create a Home Valuation Report for This Property
The Home Valuation Report is an in-depth analysis detailing your home's value as well as a comparison with similar homes in the area
Home Values in the Area
Average Home Value in this Area
Purchase History
| Date | Buyer | Sale Price | Title Company |
|---|---|---|---|
| Tan George Bhuriwat | $2,651,000 | Old Republic Title Co | |
| Evans Mary B | $1,725,000 | Old Republic Title Company | |
| Vrolyk Anne K | -- | Old Republic Title Company | |
| Vrolyk Anne | -- | First American Title Guarant |
Source: Public Records
Mortgage History
| Date | Status | Borrower | Loan Amount |
|---|---|---|---|
| Open | Tan George Bhuriwat | $2,120,800 | |
| Previous Owner | Vrolyk Anne K | $1,100,000 | |
| Previous Owner | Vrolyk Anne | $200,000 |
Source: Public Records
Tax History Compared to Growth
Tax History
| Year | Tax Paid | Tax Assessment Tax Assessment Total Assessment is a certain percentage of the fair market value that is determined by local assessors to be the total taxable value of land and additions on the property. | Land | Improvement |
|---|---|---|---|---|
| 2025 | $34,086 | $2,899,251 | $1,739,551 | $1,159,700 |
| 2024 | $34,086 | $2,842,404 | $1,705,443 | $1,136,961 |
| 2023 | $33,584 | $2,786,671 | $1,672,003 | $1,114,668 |
| 2022 | $32,963 | $2,732,031 | $1,639,219 | $1,092,812 |
| 2021 | $32,386 | $2,678,463 | $1,607,078 | $1,071,385 |
| 2020 | $25,057 | $2,035,996 | $1,017,998 | $1,017,998 |
| 2019 | $24,194 | $1,996,076 | $998,038 | $998,038 |
| 2018 | $23,376 | $1,956,938 | $978,469 | $978,469 |
| 2017 | $22,801 | $1,918,568 | $959,284 | $959,284 |
| 2016 | $22,450 | $1,880,950 | $940,475 | $940,475 |
| 2015 | $22,173 | $1,852,698 | $926,349 | $926,349 |
| 2014 | $21,586 | $1,816,408 | $908,204 | $908,204 |
Source: Public Records
Map
Nearby Homes
- 2145 Franklin St Unit 1
- 1830 Jackson St Unit E
- 1896 Pacific Ave Unit 202
- 1896 Pacific Ave Unit 404
- 1650 Broadway Unit 104
- 2040 Franklin St Unit 502
- 1623 Vallejo St
- 2160 Van Ness Ave
- 1701 Jackson St Unit 209
- 1701 Jackson St Unit 105
- 2000 Washington St Unit 4
- 2006 Washington St Unit 4
- 2315 Van Ness Ave Unit 2
- 1650 Jackson St Unit 707
- 1601 Pacific Ave Unit 207
- 1868 Van Ness Ave Unit 406
- 1940 Broadway Unit 2W
- 1971 Broadway
- 1788 Clay St Unit 711
- 1925 Gough St Unit 51
- 2253 Franklin St
- 2243 Franklin St
- 2247 Franklin St
- 2245 Franklin St
- 1701 Broadway Unkn Unit 4
- 1701 Broadway Unit 8
- 1701 Broadway Unit 6
- 1701 Broadway Unit 5
- 1701 Broadway Unit 4
- 1701 Broadway Unit 3
- 1701 Broadway Unit 2
- 1701 Broadway Unit 1
- 2233 Franklin St
- 2231 Franklin St
- 1739 Broadway Unit A
- 1737 Broadway
- 1800 Pacific Ave Unit 801
- 1800 Pacific Ave Unit 902
- 1800 Pacific Ave Unit 1002
- 1800 Pacific Ave Unit 702