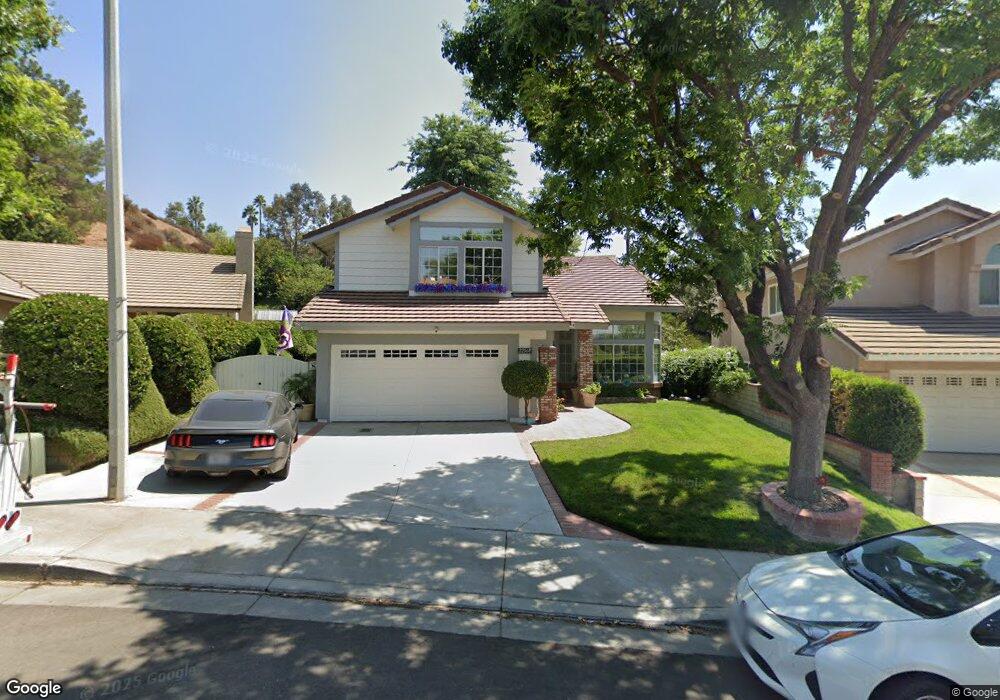
22568 Tulip Ct Santa Clarita, CA 91390
Saugus NeighborhoodEstimated Value: $832,440 - $896,000
4
Beds
3
Baths
1,859
Sq Ft
$468/Sq Ft
Est. Value
About This Home
This home is located at 22568 Tulip Ct, Santa Clarita, CA 91390 and is currently estimated at $870,610, approximately $468 per square foot. 22568 Tulip Ct is a home located in Los Angeles County with nearby schools including Mountainview Elementary School, Arroyo Seco Junior High School, and Saugus High School.
Ownership History
Date
Name
Owned For
Owner Type
Purchase Details
Closed on
Jul 24, 2015
Sold by
Violette Timothy C and Violette Cynthia A
Bought by
The Timothy & Cynthia Violette Trust
Current Estimated Value
Home Financials for this Owner
Home Financials are based on the most recent Mortgage that was taken out on this home.
Original Mortgage
$329,821
Outstanding Balance
$258,871
Interest Rate
4.05%
Mortgage Type
VA
Estimated Equity
$611,739
Purchase Details
Closed on
Dec 16, 2009
Sold by
Violette Timothy C and Violette Cynthia A
Bought by
Violette Timothy C and Violette Cynthia Ann
Purchase Details
Closed on
Dec 10, 1997
Sold by
Plutt Jo Anne L
Bought by
Violette Timothy C and Violette Cynthia A
Home Financials for this Owner
Home Financials are based on the most recent Mortgage that was taken out on this home.
Original Mortgage
$206,300
Interest Rate
7.05%
Purchase Details
Closed on
Jun 1, 1994
Sold by
Plutt P Steven
Bought by
Plutt Jo Anne L
Create a Home Valuation Report for This Property
The Home Valuation Report is an in-depth analysis detailing your home's value as well as a comparison with similar homes in the area
Home Values in the Area
Average Home Value in this Area
Purchase History
| Date | Buyer | Sale Price | Title Company |
|---|---|---|---|
| The Timothy & Cynthia Violette Trust | -- | Accommodation | |
| Violette Timothy C | -- | Fidelity National Title | |
| Violette Timothy C | -- | None Available | |
| Violette Timothy C | $217,500 | Investors Title Company | |
| Plutt Jo Anne L | -- | -- |
Source: Public Records
Mortgage History
| Date | Status | Borrower | Loan Amount |
|---|---|---|---|
| Open | Violette Timothy C | $329,821 | |
| Previous Owner | Violette Timothy C | $206,300 |
Source: Public Records
Tax History Compared to Growth
Tax History
| Year | Tax Paid | Tax Assessment Tax Assessment Total Assessment is a certain percentage of the fair market value that is determined by local assessors to be the total taxable value of land and additions on the property. | Land | Improvement |
|---|---|---|---|---|
| 2025 | $5,912 | $346,790 | $119,423 | $227,367 |
| 2024 | $5,912 | $339,991 | $117,082 | $222,909 |
| 2023 | $5,694 | $333,326 | $114,787 | $218,539 |
| 2022 | $5,668 | $326,791 | $112,537 | $214,254 |
| 2021 | $5,531 | $320,384 | $110,331 | $210,053 |
| 2019 | $5,379 | $310,883 | $107,059 | $203,824 |
| 2018 | $5,248 | $304,788 | $104,960 | $199,828 |
| 2016 | $4,861 | $292,954 | $100,885 | $192,069 |
| 2015 | $4,704 | $288,554 | $99,370 | $189,184 |
| 2014 | -- | $282,903 | $97,424 | $185,479 |
Source: Public Records
Map
Nearby Homes
- 22440 Skylake Place
- 28241 Tamarack Ln
- 28345 Seco Canyon Rd Unit 97
- 28321 Evergreen Ln
- 28341 Seco Canyon Rd Unit 107
- 28415 Seco Canyon Rd Unit 125
- 22839 Banyan Place Unit 334
- 28251 Infinity Cir
- 22617 Copper Hill Dr Unit 121
- 22713 Copper Hill Dr Unit 42
- 28123 Seco Canyon Rd Unit 94
- 28114 Seco Canyon Rd Unit 156
- 28121 Seco Canyon Rd Unit 86
- 22943 Banyan Place Unit 306
- 28724 Magnolia Way
- 28419 Hidden Hills Dr
- 27872 Cherry Creek Dr
- 22411 Holly Ct
- 22825 Aspen Ct
- 22025 Lytle Ct
- 22572 Tulip Ct
- 22562 Tulip Ct
- 22551 Hickory Place
- 22576 Tulip Ct
- 22576 Tulip Ct
- 22558 Tulip Ct
- 22552 Hickory Place
- 28350 Tamarack Ln
- 22555 Hickory Place
- 22580 Tulip Ct
- 22561 Tulip Ct
- 28344 Tamarack Ln
- 22554 Tulip Ct
- 22554 Hickory Place
- 22559 Hickory Place
- 28336 Tamarack Ln
- 22557 Tulip Ct
- 28328 Tamarack Ln
- 22553 Tulip Ct
- 22565 Hickory Place