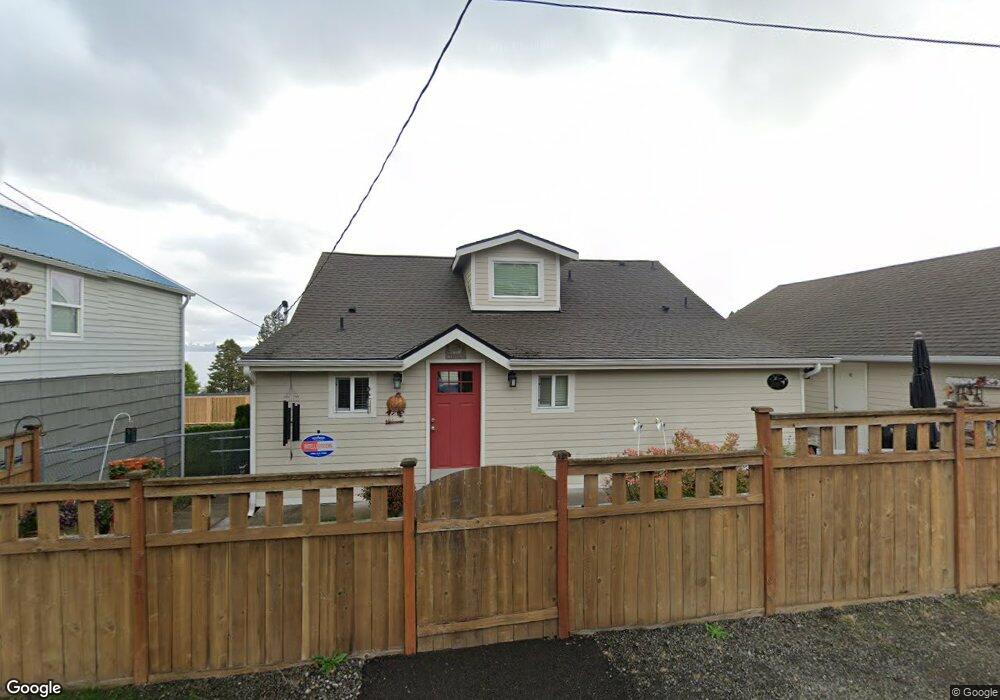
2257 E Spring St Port Orchard, WA 98366
Manchester NeighborhoodEstimated Value: $534,496 - $611,000
2
Beds
3
Baths
1,532
Sq Ft
$371/Sq Ft
Est. Value
About This Home
This home is located at 2257 E Spring St, Port Orchard, WA 98366 and is currently estimated at $568,874, approximately $371 per square foot. 2257 E Spring St is a home located in Kitsap County with nearby schools including Manchester Elementary School, John Sedgwick Middle School, and South Kitsap High School.
Ownership History
Date
Name
Owned For
Owner Type
Purchase Details
Closed on
Apr 18, 2014
Sold by
Harbor Rentals Llc
Bought by
Fox Dixie A
Current Estimated Value
Purchase Details
Closed on
Oct 11, 2012
Sold by
Fox Dixie A
Bought by
Harbor Rentals Llc
Purchase Details
Closed on
Sep 25, 2012
Sold by
Fox Dixie A and Kintner James P
Bought by
Fox Dixie A
Purchase Details
Closed on
Jul 6, 2007
Sold by
Fox Dixie A and Estate Of Robert C Fox
Bought by
Fox Dixie A and Kintner James P
Create a Home Valuation Report for This Property
The Home Valuation Report is an in-depth analysis detailing your home's value as well as a comparison with similar homes in the area
Home Values in the Area
Average Home Value in this Area
Purchase History
| Date | Buyer | Sale Price | Title Company |
|---|---|---|---|
| Fox Dixie A | -- | None Available | |
| Harbor Rentals Llc | -- | None Available | |
| Fox Dixie A | -- | None Available | |
| Fox Dixie A | -- | None Available |
Source: Public Records
Tax History Compared to Growth
Tax History
| Year | Tax Paid | Tax Assessment Tax Assessment Total Assessment is a certain percentage of the fair market value that is determined by local assessors to be the total taxable value of land and additions on the property. | Land | Improvement |
|---|---|---|---|---|
| 2026 | $4,457 | $514,650 | $172,450 | $342,200 |
| 2025 | $4,457 | $514,650 | $172,450 | $342,200 |
| 2024 | $4,321 | $514,650 | $172,450 | $342,200 |
| 2023 | $4,290 | $514,650 | $172,450 | $342,200 |
| 2022 | $4,157 | $417,510 | $137,720 | $279,790 |
| 2021 | $3,871 | $367,540 | $119,760 | $247,780 |
| 2020 | $3,523 | $324,400 | $91,550 | $232,850 |
| 2019 | $3,042 | $307,970 | $86,730 | $221,240 |
| 2018 | $3,227 | $248,990 | $75,260 | $173,730 |
| 2017 | $2,709 | $248,990 | $75,260 | $173,730 |
| 2016 | $2,691 | $226,410 | $71,680 | $154,730 |
| 2015 | $2,428 | $206,600 | $71,680 | $134,920 |
| 2014 | -- | $152,660 | $80,330 | $72,330 |
| 2013 | -- | $152,660 | $80,330 | $72,330 |
Source: Public Records
Map
Nearby Homes
- 8095 E Daniels Loop
- 2372 Valley Ave E
- 7940 Beach Dr E
- 1630 & 1632 Colchester Dr E
- 7368 E Wyoming St
- 8471 E Caraway Rd
- 7590 E Idaho St
- 7569 E Montana St
- 7260 E Last Refuge Way
- 1738 Lilypad Place E
- 1083 Puget Dr E
- 5 Lots Lilypad Place E
- 8185 E Seaview Dr
- 7041 E Washington St
- 7000 E Dakota St
- 8154 E Seaview Dr
- 7560 E Harrison St
- 7275 E Harrison St
- 7081 E Bullseye St
- 7058 E Nightingale St
- 2281 E Spring St
- 2281 Spring St E
- 2256 Colchester Dr E
- 2295 Spring St E
- 2295 E Spring St
- 2280 Colchester Dr E
- 2236 Colchester Dr E
- 2278 E Spring St
- 2205 E Spring St
- 8031 E Spruce St
- 2212 Spring St E
- 0 Spring (The Rainier) St E Unit 618824
- 0 Spring (The Alki) St E Unit 618820
- 0 Spring (The Blakely) St E Unit 618813
- 0 Spring (The Skyline Suite) St E Unit 618810
- 0 Spring (Baker Suite) St E Unit 618756
- 2212 E Spring St
- 2220 Colchester Dr E
- 2309 E Spring St
- 7956 E Fir St