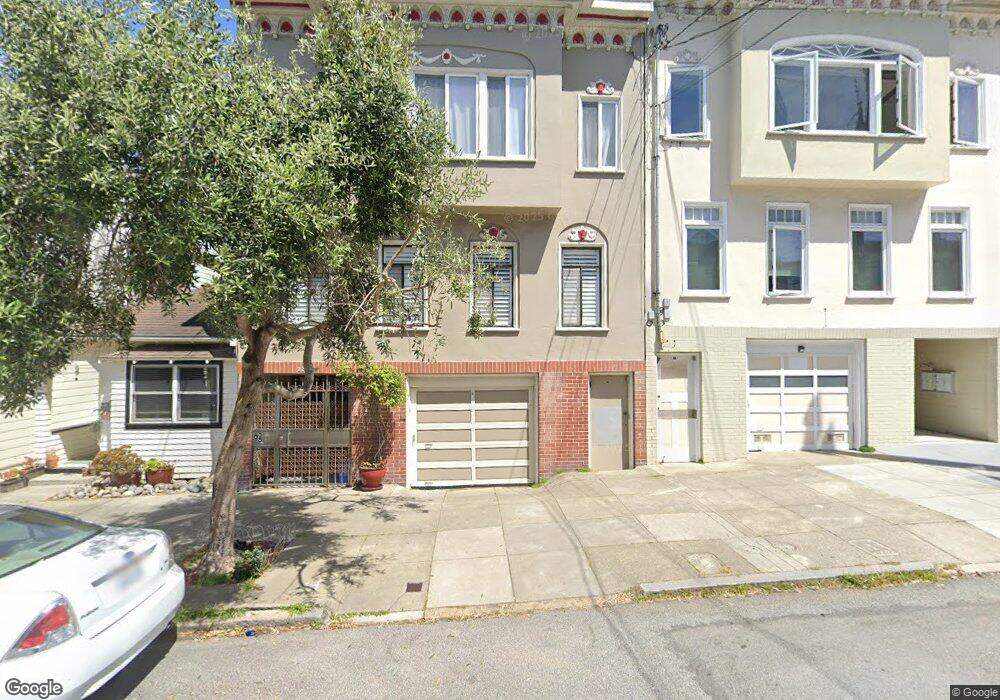
226 19th Ave Unit 1 San Francisco, CA 94121
Central Richmond NeighborhoodEstimated Value: $786,850 - $861,000
1
Bed
1
Bath
725
Sq Ft
$1,143/Sq Ft
Est. Value
About This Home
This home is located at 226 19th Ave Unit 1, San Francisco, CA 94121 and is currently estimated at $828,713, approximately $1,143 per square foot. 226 19th Ave Unit 1 is a home located in San Francisco County with nearby schools including Alamo Elementary School, Presidio Middle School, and St. Monica School.
Ownership History
Date
Name
Owned For
Owner Type
Purchase Details
Closed on
May 15, 2017
Sold by
Bondoux Jason A and Bondoux Mary K
Bought by
Mullan James Matthew and Mullan Rosanne Marie
Current Estimated Value
Purchase Details
Closed on
May 7, 2016
Sold by
Chen Kenny and Santoso Amelia
Bought by
Bondoux Jason A and Bondoux Mary K
Purchase Details
Closed on
Jul 15, 2013
Sold by
Soukup Christopher Abbott
Bought by
Tam Bessie Bik Chun
Home Financials for this Owner
Home Financials are based on the most recent Mortgage that was taken out on this home.
Original Mortgage
$303,400
Interest Rate
4.5%
Mortgage Type
New Conventional
Purchase Details
Closed on
Jul 3, 2013
Sold by
Bondoux Jason A and Bondoux Jason Anthony
Bought by
Bondoux Jason A and Bondoux Mary K
Home Financials for this Owner
Home Financials are based on the most recent Mortgage that was taken out on this home.
Original Mortgage
$303,400
Interest Rate
4.5%
Mortgage Type
New Conventional
Create a Home Valuation Report for This Property
The Home Valuation Report is an in-depth analysis detailing your home's value as well as a comparison with similar homes in the area
Home Values in the Area
Average Home Value in this Area
Purchase History
| Date | Buyer | Sale Price | Title Company |
|---|---|---|---|
| Mullan James Matthew | $755,000 | Fidelity National Title Co | |
| Bondoux Jason A | -- | Fidelity National Title Co | |
| Tam Bessie Bik Chun | -- | Chicago Title Company | |
| Bondoux Jason A | -- | Chicago Title Company |
Source: Public Records
Mortgage History
| Date | Status | Borrower | Loan Amount |
|---|---|---|---|
| Previous Owner | Bondoux Jason A | $303,400 |
Source: Public Records
Tax History Compared to Growth
Tax History
| Year | Tax Paid | Tax Assessment Tax Assessment Total Assessment is a certain percentage of the fair market value that is determined by local assessors to be the total taxable value of land and additions on the property. | Land | Improvement |
|---|---|---|---|---|
| 2025 | $10,981 | $876,240 | $438,120 | $438,120 |
| 2024 | $10,981 | $859,060 | $429,530 | $429,530 |
| 2023 | $10,685 | $842,216 | $421,108 | $421,108 |
| 2022 | $10,474 | $825,702 | $412,851 | $412,851 |
| 2021 | $10,286 | $809,512 | $404,756 | $404,756 |
| 2020 | $10,392 | $801,212 | $400,606 | $400,606 |
| 2019 | $9,990 | $785,502 | $392,751 | $392,751 |
| 2018 | $9,655 | $770,100 | $385,050 | $385,050 |
| 2017 | $6,587 | $528,450 | $317,071 | $211,379 |
Source: Public Records
Map
Nearby Homes
- 172 18th Ave
- 1827 Clement St
- 1533 Clement St
- 369 18th Ave Unit 203
- 1 18th Ave
- 118 15th Ave
- 118-120 15th Ave
- 154-156 Funston Ave
- 428 15th Ave
- 375 25th Ave Unit 401
- 252 26th Ave
- 6423 California St
- 519 22nd Ave
- 50 25th Ave
- 4829 California St
- 1608 Balboa St
- 1545-1547 Balboa St
- 574 26th Ave Unit 3
- 459 11th Ave
- 171 9th Ave Unit 173
- 226 19th Ave Unit 2
- 226 19th Ave Unit 4
- 222 19th Ave
- 230 19th Ave
- 218 19th Ave Unit 220
- 214 19th Ave
- 210 19th Ave
- 5637 California St
- 227 18th Ave Unit 229
- 231 18th Ave
- 223 18th Ave Unit 225
- 5631 California St Unit 5633
- 200 19th Ave
- 221 19th Ave
- 5625 California St
- 215 18th Ave Unit 217
- 215 19th Ave Unit 217
- 235 19th Ave Unit 5
- 235 19th Ave Unit 4
- 235 19th Ave Unit 3