Estimated Value: $333,000 - $354,000
--
Bed
2
Baths
2,522
Sq Ft
$138/Sq Ft
Est. Value
About This Home
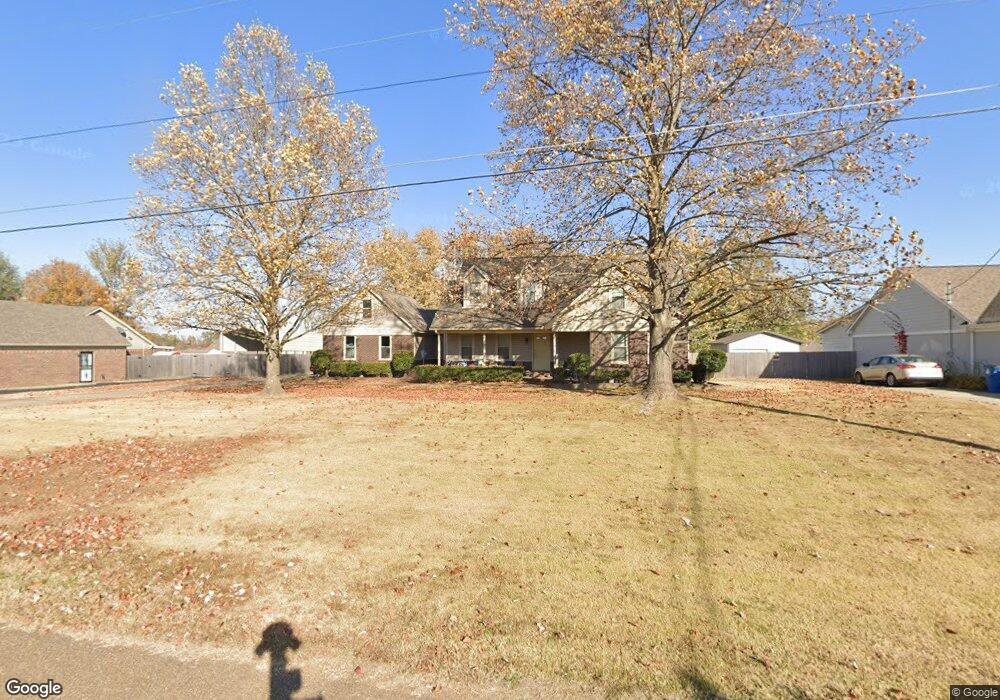
This home is located at 226 Anita Dr, Atoka, TN 38004 and is currently estimated at $346,965, approximately $137 per square foot. 226 Anita Dr is a home located in Tipton County with nearby schools including Atoka Elementary School, Brighton Middle School, and Brighton High School.
Ownership History
Date
Name
Owned For
Owner Type
Purchase Details
Closed on
Mar 9, 2009
Sold by
Ware Kenneth W
Bought by
King Randy
Current Estimated Value
Purchase Details
Closed on
May 7, 2002
Sold by
Ware Bobbie S
Bought by
Randy King
Purchase Details
Closed on
Apr 23, 2001
Sold by
Ware Jessie W
Bought by
Ware Bobbie S
Purchase Details
Closed on
Feb 1, 1999
Sold by
Martin Jackie C
Bought by
Ware Jessie W
Home Financials for this Owner
Home Financials are based on the most recent Mortgage that was taken out on this home.
Original Mortgage
$128,024
Interest Rate
6.85%
Purchase Details
Closed on
May 26, 1994
Bought by
Martin Jackie C and Martin Cindy
Purchase Details
Closed on
Jan 19, 1994
Bought by
Barger Billy and Barger Tommie L
Purchase Details
Closed on
Aug 13, 1992
Bought by
Parham William L and Parham Julia M
Purchase Details
Closed on
Sep 6, 1990
Bought by
Linder James and Holland Frank
Purchase Details
Closed on
Oct 24, 1988
Bought by
Munford Development Co
Create a Home Valuation Report for This Property
The Home Valuation Report is an in-depth analysis detailing your home's value as well as a comparison with similar homes in the area
Home Values in the Area
Average Home Value in this Area
Purchase History
| Date | Buyer | Sale Price | Title Company |
|---|---|---|---|
| King Randy | -- | -- | |
| Randy King | -- | -- | |
| Ware Bobbie S | $124,929 | -- | |
| Ware Jessie W | $128,250 | -- | |
| Martin Jackie C | $102,500 | -- | |
| Barger Billy | $11,000 | -- | |
| Parham William L | -- | -- | |
| Linder James | -- | -- | |
| Munford Development Co | -- | -- |
Source: Public Records
Mortgage History
| Date | Status | Borrower | Loan Amount |
|---|---|---|---|
| Previous Owner | Munford Development Co | $128,024 |
Source: Public Records
Tax History Compared to Growth
Tax History
| Year | Tax Paid | Tax Assessment Tax Assessment Total Assessment is a certain percentage of the fair market value that is determined by local assessors to be the total taxable value of land and additions on the property. | Land | Improvement |
|---|---|---|---|---|
| 2024 | $1,688 | $74,825 | $8,675 | $66,150 |
| 2023 | $1,688 | $74,825 | $8,675 | $66,150 |
| 2022 | $1,616 | $52,625 | $6,375 | $46,250 |
| 2021 | $1,589 | $52,625 | $6,375 | $46,250 |
| 2020 | $1,588 | $52,625 | $6,375 | $46,250 |
| 2019 | $1,479 | $41,200 | $6,375 | $34,825 |
| 2018 | $1,479 | $41,200 | $6,375 | $34,825 |
| 2017 | $1,327 | $41,200 | $6,375 | $34,825 |
| 2016 | $1,327 | $41,200 | $6,375 | $34,825 |
| 2015 | $1,325 | $41,200 | $6,375 | $34,825 |
| 2014 | $1,225 | $41,204 | $0 | $0 |
Source: Public Records
Map
Nearby Homes
- 239 Blaydes Dr
- 298 Anita Dr
- 461 Blaydes Dr
- 135 Jaimes Ln
- 235 Hawthorn Ln
- 523 Sterling Ridge Dr
- 82 Ridge Top Cove
- 665 Betty Boyd Ln
- 135 Duncan Dr
- 76 Tealwood Cove
- 242 Timothy Rd
- 56 Madison Dr
- 210 Duncan Dr
- 336 Sterling Ridge Dr
- 102 Trinity Cove
- 10 Eureka Trail
- 33 Ward Ln
- 425 Eureka Trail
- 142 Eureka Trail
- 235 Kingston Ave
- 210 Anita Dr
- 242 Anita Dr
- 335 Blaydes Dr
- 313 Blaydes Dr
- 313 Blaydes Dr Unit Blaydes Dr.
- 361 Blaydes Dr
- 176 Anita Dr
- 241 Anita Dr
- 219 Anita Dr
- 268 Anita Dr
- 381 Blaydes Dr
- 295 Blaydes Dr
- 175 Anita Dr
- 40 William Blaydes St
- 68 Elliot Dr
- 269 Anita Dr
- 399 Blaydes Dr
- 271 Blaydes Dr
- 155 Anita Dr
- 41 William Blaydes St