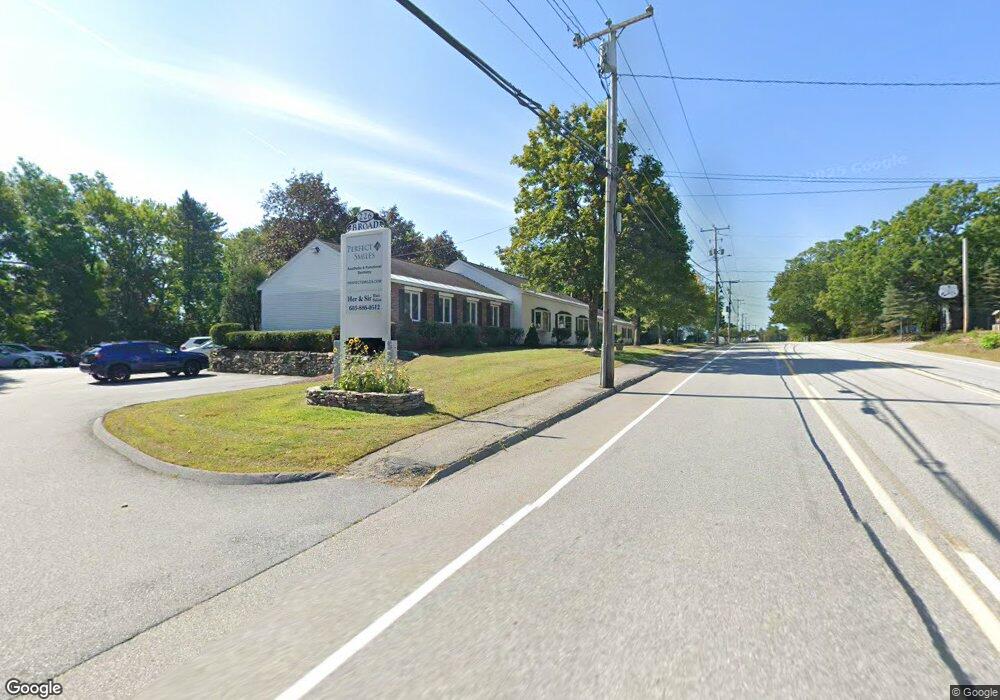
226 Broad St Nashua, NH 03063
Northwest Nashua Neighborhood
--
Bed
--
Bath
6,570
Sq Ft
0.81
Acres
About This Home
This home is located at 226 Broad St, Nashua, NH 03063. 226 Broad St is a home located in Hillsborough County with nearby schools including Broad Street Elementary School, Elm Street Middle School, and Nashua High School North.
Ownership History
Date
Name
Owned For
Owner Type
Purchase Details
Closed on
Feb 5, 2024
Sold by
Apex Mereor Llc
Bought by
Sai Properties Llc
Home Financials for this Owner
Home Financials are based on the most recent Mortgage that was taken out on this home.
Original Mortgage
$1,850,000
Outstanding Balance
$1,813,662
Interest Rate
6.61%
Mortgage Type
Purchase Money Mortgage
Purchase Details
Closed on
Jan 22, 2024
Sold by
Houghton Stephany C
Bought by
Houghton Stephany C and Houghton B W
Home Financials for this Owner
Home Financials are based on the most recent Mortgage that was taken out on this home.
Original Mortgage
$1,850,000
Outstanding Balance
$1,813,662
Interest Rate
6.61%
Mortgage Type
Purchase Money Mortgage
Purchase Details
Closed on
Jul 19, 2022
Sold by
Sullivan Christopher A
Bought by
Sullivan Stephanie
Purchase Details
Closed on
Sep 29, 1993
Bought by
Houghton Stephany C
Create a Home Valuation Report for This Property
The Home Valuation Report is an in-depth analysis detailing your home's value as well as a comparison with similar homes in the area
Home Values in the Area
Average Home Value in this Area
Purchase History
| Date | Buyer | Sale Price | Title Company |
|---|---|---|---|
| Sai Properties Llc | $1,050,000 | None Available | |
| Sai Properties Llc | $1,050,000 | None Available | |
| Houghton Stephany C | -- | None Available | |
| Houghton Stephany C | -- | None Available | |
| Sullivan Stephanie | -- | None Available | |
| Sullivan Stephanie | -- | None Available | |
| Houghton Stephany C | $112,500 | -- |
Source: Public Records
Mortgage History
| Date | Status | Borrower | Loan Amount |
|---|---|---|---|
| Open | Sai Properties Llc | $1,850,000 | |
| Closed | Sai Properties Llc | $1,850,000 |
Source: Public Records
Tax History Compared to Growth
Tax History
| Year | Tax Paid | Tax Assessment Tax Assessment Total Assessment is a certain percentage of the fair market value that is determined by local assessors to be the total taxable value of land and additions on the property. | Land | Improvement |
|---|---|---|---|---|
| 2024 | $9,953 | $626,000 | $145,500 | $480,500 |
| 2023 | $10,539 | $578,100 | $126,600 | $451,500 |
| 2022 | $10,446 | $578,100 | $126,600 | $451,500 |
| 2021 | $14,545 | $626,400 | $120,500 | $505,900 |
| 2020 | $14,000 | $619,200 | $120,500 | $498,700 |
| 2019 | $13,474 | $619,200 | $120,500 | $498,700 |
| 2018 | $13,133 | $619,200 | $120,500 | $498,700 |
| 2017 | $15,912 | $617,000 | $131,800 | $485,200 |
| 2016 | $15,468 | $617,000 | $131,800 | $485,200 |
| 2015 | $15,135 | $617,000 | $131,800 | $485,200 |
| 2014 | $14,839 | $617,000 | $131,800 | $485,200 |
Source: Public Records
Map
Nearby Homes
- 239 Broad St
- 19 Dunloggin Rd
- 7 Robert Dr
- 22 Berkshire Rd
- 3 Wright Rd
- 5 Chatfield Dr Unit U18
- 4 Jared Cir Unit U21
- 424 Broad St
- 11 Inca Dr
- 11 Amherst Terrace
- 7 Bitirnas St Unit U7
- 74 Profile Cir
- 14 Parrish Hill Dr
- 31 Ashland St
- 0 Baldwin St
- 58 Profile Cir
- 5 Meghan Dr Unit U23
- 36 Hampton Dr
- 6 Cornwall Ln Unit 7
- 32-34 Grand Ave