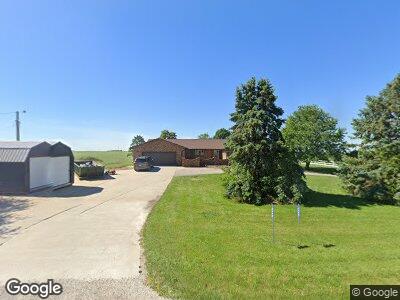
2260 330th St Woolstock, IA 50599
Estimated Value: $166,000 - $517,505
5
Beds
6
Baths
3,111
Sq Ft
$110/Sq Ft
Est. Value
About This Home
This home is located at 2260 330th St, Woolstock, IA 50599 and is currently estimated at $340,835, approximately $109 per square foot. 2260 330th St is a home located in Wright County with nearby schools including Northeast Hamilton Elementary School, Pleasant View Elementary School, and Sunset Heights Elementary School.
Ownership History
Date
Name
Owned For
Owner Type
Purchase Details
Closed on
Jul 12, 2023
Sold by
Hanus Amy L
Bought by
Engstler Brian and Engstler Emily Hill
Current Estimated Value
Purchase Details
Closed on
Mar 11, 2013
Sold by
Gilbert Jeana M and Gilbert Jeana M
Bought by
Engstler Brian and Engstler Emily Hill
Home Financials for this Owner
Home Financials are based on the most recent Mortgage that was taken out on this home.
Original Mortgage
$200,000
Interest Rate
2.72%
Mortgage Type
New Conventional
Purchase Details
Closed on
Jan 30, 2008
Sold by
Eide David L
Bought by
Gilbert Jeana M and Gilbert Eide Jeana M
Home Financials for this Owner
Home Financials are based on the most recent Mortgage that was taken out on this home.
Original Mortgage
$196,000
Interest Rate
6.11%
Mortgage Type
New Conventional
Create a Home Valuation Report for This Property
The Home Valuation Report is an in-depth analysis detailing your home's value as well as a comparison with similar homes in the area
Home Values in the Area
Average Home Value in this Area
Purchase History
| Date | Buyer | Sale Price | Title Company |
|---|---|---|---|
| Engstler Brian | -- | None Listed On Document | |
| Engstler Brian | $200,000 | None Available | |
| Gilbert Jeana M | -- | None Available |
Source: Public Records
Mortgage History
| Date | Status | Borrower | Loan Amount |
|---|---|---|---|
| Open | Engstler Brian | $243,788 | |
| Previous Owner | Engstler Brian | $295,939 | |
| Previous Owner | Engstler Emily H | $298,381 | |
| Previous Owner | Engstler Brian | $200,000 | |
| Previous Owner | Gilbert Jeana M | $196,000 |
Source: Public Records
Tax History Compared to Growth
Tax History
| Year | Tax Paid | Tax Assessment Tax Assessment Total Assessment is a certain percentage of the fair market value that is determined by local assessors to be the total taxable value of land and additions on the property. | Land | Improvement |
|---|---|---|---|---|
| 2024 | $6,788 | $565,900 | $33,800 | $532,100 |
| 2023 | $7,544 | $559,600 | $33,800 | $525,800 |
| 2022 | $5,966 | $525,000 | $33,800 | $491,200 |
| 2021 | $5,966 | $416,400 | $33,800 | $382,600 |
| 2020 | $4,300 | $315,200 | $30,000 | $285,200 |
| 2019 | $3,150 | $221,100 | $0 | $0 |
| 2018 | $2,830 | $187,400 | $0 | $0 |
| 2017 | $2,874 | $187,200 | $0 | $0 |
| 2016 | $2,834 | $187,200 | $0 | $0 |
| 2015 | $2,768 | $187,200 | $0 | $0 |
| 2014 | $2,768 | $231,300 | $0 | $0 |
Source: Public Records