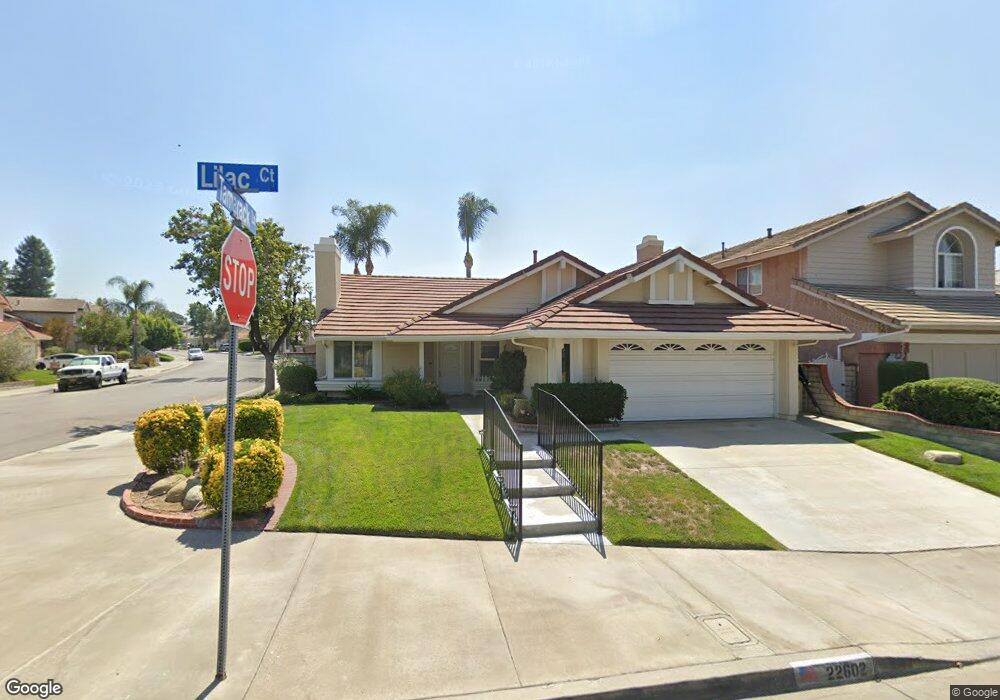
22602 Lilac Ct Santa Clarita, CA 91390
Saugus NeighborhoodEstimated Value: $747,377 - $811,000
3
Beds
2
Baths
1,375
Sq Ft
$564/Sq Ft
Est. Value
About This Home
This home is located at 22602 Lilac Ct, Santa Clarita, CA 91390 and is currently estimated at $775,594, approximately $564 per square foot. 22602 Lilac Ct is a home located in Los Angeles County with nearby schools including Mountainview Elementary School, Arroyo Seco Junior High School, and Saugus High School.
Ownership History
Date
Name
Owned For
Owner Type
Purchase Details
Closed on
May 13, 2016
Sold by
Marks Jack A and Marks Dirk S
Bought by
Marks Jack A and Marks Dirk S
Current Estimated Value
Purchase Details
Closed on
Mar 24, 2011
Sold by
Marks Jack A and Marks Vivian F
Bought by
Marks Jack A and Marks Vivian F
Purchase Details
Closed on
Mar 18, 2008
Sold by
Galloway Jane
Bought by
Marks Jack S and Marks Vivian F
Purchase Details
Closed on
Apr 16, 2001
Sold by
Kelley Kym A
Bought by
Galloway Stanley and Galloway Jane
Home Financials for this Owner
Home Financials are based on the most recent Mortgage that was taken out on this home.
Original Mortgage
$115,000
Interest Rate
6.89%
Purchase Details
Closed on
Aug 29, 1998
Sold by
Kelley Michael
Bought by
Kelley Kym A
Purchase Details
Closed on
Jul 23, 1998
Sold by
Agaman John H and Agaman Jody B
Bought by
Kelley Kym A
Create a Home Valuation Report for This Property
The Home Valuation Report is an in-depth analysis detailing your home's value as well as a comparison with similar homes in the area
Home Values in the Area
Average Home Value in this Area
Purchase History
| Date | Buyer | Sale Price | Title Company |
|---|---|---|---|
| Marks Jack A | -- | None Available | |
| Marks Jack A | -- | None Available | |
| Marks Jack S | $440,000 | Southland Title | |
| Galloway Stanley | $240,000 | Southland Title Corporation | |
| Kelley Kym A | -- | First American Title Co | |
| Kelley Kym A | $210,000 | First American Title Co |
Source: Public Records
Mortgage History
| Date | Status | Borrower | Loan Amount |
|---|---|---|---|
| Previous Owner | Galloway Stanley | $115,000 |
Source: Public Records
Tax History Compared to Growth
Tax History
| Year | Tax Paid | Tax Assessment Tax Assessment Total Assessment is a certain percentage of the fair market value that is determined by local assessors to be the total taxable value of land and additions on the property. | Land | Improvement |
|---|---|---|---|---|
| 2025 | $2,950 | $95,894 | $37,309 | $58,585 |
| 2024 | $2,950 | $94,015 | $36,578 | $57,437 |
| 2023 | $2,787 | $92,172 | $35,861 | $56,311 |
| 2022 | $2,740 | $90,365 | $35,158 | $55,207 |
| 2021 | $2,653 | $88,594 | $34,469 | $54,125 |
| 2019 | $2,615 | $85,969 | $33,448 | $52,521 |
| 2018 | $2,482 | $84,285 | $32,793 | $51,492 |
| 2016 | $2,230 | $81,014 | $31,520 | $49,494 |
| 2015 | $2,170 | $79,798 | $31,047 | $48,751 |
| 2014 | $2,148 | $78,236 | $30,439 | $47,797 |
Source: Public Records
Map
Nearby Homes
- 28345 Seco Canyon Rd Unit 97
- 28341 Seco Canyon Rd Unit 107
- 28321 Evergreen Ln
- 28241 Tamarack Ln
- 28415 Seco Canyon Rd Unit 125
- 22440 Skylake Place
- 22839 Banyan Place Unit 334
- 28123 Seco Canyon Rd Unit 94
- 28251 Infinity Cir
- 22713 Copper Hill Dr Unit 42
- 22617 Copper Hill Dr Unit 121
- 28121 Seco Canyon Rd Unit 86
- 28114 Seco Canyon Rd Unit 156
- 22943 Banyan Place Unit 306
- 28724 Magnolia Way
- 28419 Hidden Hills Dr
- 27872 Cherry Creek Dr
- 22825 Aspen Ct
- 22411 Holly Ct
- 22025 Lytle Ct
- 22610 Lilac Ct
- 22605 Palm Ct
- 22614 Lilac Ct
- 22609 Palm Ct
- 22580 Tulip Ct
- 22613 Palm Ct
- 22620 Lilac Ct
- 22603 Lilac Ct
- 22609 Lilac Ct
- 22576 Tulip Ct
- 22576 Tulip Ct
- 28350 Tamarack Ln
- 22615 Lilac Ct
- 22617 Palm Ct
- 22626 Lilac Ct
- 22561 Tulip Ct
- 28344 Tamarack Ln
- 22621 Lilac Ct
- 22604 Palm Ct
- 22572 Tulip Ct